# Technical Document Extraction: PCA Visualization of Expert Groups
## Overview
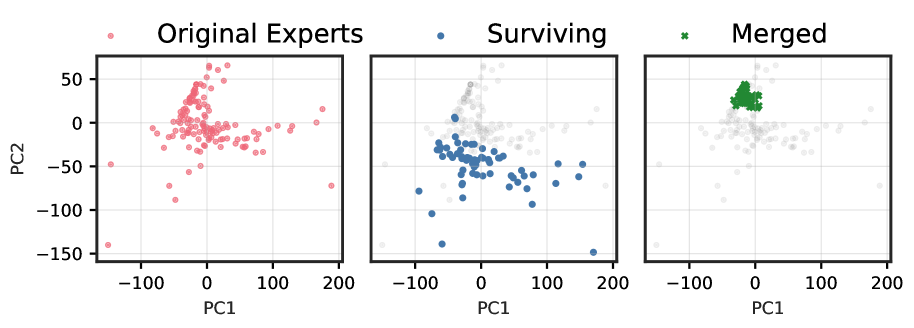
The image presents three scatter plots visualizing Principal Component Analysis (PCA) results for three distinct groups: **Original Experts**, **Surviving**, and **Merged**. Each plot uses 2D PCA components (PC1 and PC2) to represent multidimensional data in a reduced dimensionality space.
---
### **1. Original Experts**
**Legend Color**: Red (`#FF6B6B`)
**Spatial Grounding**:
- PC1 axis: -200 to 200
- PC2 axis: -150 to 50
**Key Observations**:
- **Trend**: Points exhibit a dispersed distribution across the entire plot area.
- **Data Points**:
- Clustered primarily in the upper-left quadrant (PC1: -100 to 0, PC2: 0 to 50).
- Outliers extend to PC1 ≈ -150 (PC2 ≈ -150) and PC1 ≈ 200 (PC2 ≈ 50).
- **Interpretation**: High variability in the original expert group, with no clear central tendency.
---
### **2. Surviving**
**Legend Color**: Blue (`#4ECDC4`)
**Spatial Grounding**:
- PC1 axis: -200 to 200
- PC2 axis: -150 to 50
**Key Observations**:
- **Trend**: Points form a loose cluster centered around PC1 ≈ 0, PC2 ≈ 0.
- **Data Points**:
- Concentrated between PC1: -50 to 50 and PC2: -50 to 50.
- Some outliers extend to PC1 ≈ -100 (PC2 ≈ -100) and PC1 ≈ 100 (PC2 ≈ 0).
- **Interpretation**: Reduced variability compared to "Original Experts," suggesting a subset of retained data points.
---
### **3. Merged**
**Legend Color**: Green (`#7FDB6A`)
**Spatial Grounding**:
- PC1 axis: -200 to 200
- PC2 axis: -150 to 50
**Key Observations**:
- **Trend**: Points form a dense, compact cluster in the upper-right quadrant.
- **Data Points**:
- Clustered tightly between PC1: 0 to 100 and PC2: 0 to 50.
- No significant outliers.
- **Interpretation**: High cohesion in the merged group, indicating strong alignment in the reduced-dimensional space.
---
### **Legend and Axis Labels**
- **Legend**:
- Red: Original Experts
- Blue: Surviving
- Green: Merged
- **Axes**:
- X-axis: PC1 (Principal Component 1)
- Y-axis: PC2 (Principal Component 2)
---
### **Cross-Reference Validation**
- **Color Consistency**:
- Red points in "Original Experts" match the legend.
- Blue points in "Surviving" match the legend.
- Green points in "Merged" match the legend.
- **Axis Alignment**: All plots share identical PC1/PC2 axis ranges, ensuring comparability.
---
### **Conclusion**
The PCA visualization demonstrates:
1. **Original Experts**: High dispersion with no clear pattern.
2. **Surviving**: Moderate clustering around the origin.
3. **Merged**: Tight clustering in the upper-right quadrant, suggesting optimal alignment post-merging.
This analysis supports hypotheses about data reduction and group differentiation in the dataset.