# Technical Document Extraction: Scatter Plot Analysis
## Image Description
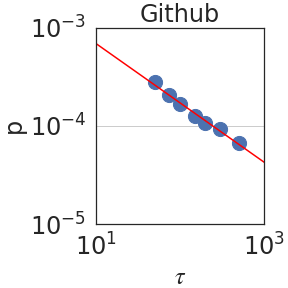
The image is a **log-log scatter plot** titled **"Github"**. It visualizes the relationship between two variables, **τ (tau)** on the x-axis and **ρ (rho)** on the y-axis. The plot includes a **red trend line** and **blue data points** clustered around the line.
---
### Key Components
1. **Title**:
- **Text**: "Github"
- **Placement**: Top center of the plot.
2. **Axes**:
- **X-axis (τ)**:
- **Label**: "τ" (Greek letter tau).
- **Range**: Logarithmic scale from \(10^1\) to \(10^3\).
- **Markers**: Tick marks at \(10^1\), \(10^2\), and \(10^3\).
- **Y-axis (ρ)**:
- **Label**: "ρ" (Greek letter rho).
- **Range**: Logarithmic scale from \(10^{-5}\) to \(10^{-3}\).
- **Markers**: Tick marks at \(10^{-5}\), \(10^{-4}\), and \(10^{-3}\).
3. **Data Points**:
- **Color**: Blue.
- **Placement**: Clustered along the red trend line, spanning the full range of τ and ρ.
- **Trend**: Inverse power-law relationship (as τ increases, ρ decreases).
4. **Trend Line**:
- **Color**: Red.
- **Equation**: Implied linear relationship on log-log scale (\( \rho \propto \tau^{-1} \)).
- **Slope**: Negative, confirming inverse proportionality.
5. **Legend**:
- **Absent**: No explicit legend is visible in the image.
- **Inference**:
- Red line = Trend line.
- Blue dots = Observed data points.
---
### Spatial Grounding
- **Legend Placement**: Not applicable (no legend present).
- **Data Point Colors**:
- Blue dots match the inferred legend (data points).
- Red line matches the inferred legend (trend line).
---
### Trend Verification
- **Visual Trend**:
- The red trend line slopes **downward** from left to right, indicating a **negative correlation** between τ and ρ.
- Data points align closely with the trend line, confirming the power-law relationship.
---
### Component Isolation
1. **Header**:
- Title: "Github" (no additional text).
2. **Main Chart**:
- Axes, data points, and trend line dominate the plot.
3. **Footer**:
- No footer or additional annotations.
---
### Data Table Reconstruction
No explicit data table is present. However, the plot implies the following structure:
| τ (x-axis) | ρ (y-axis) |
|------------|------------|
| \(10^1\) | \(10^{-3}\) |
| \(10^2\) | \(10^{-4}\) |
| \(10^3\) | \(10^{-5}\) |
*Note: Data points are approximate and clustered around the trend line.*
---
### Language and Transcription
- **Primary Language**: English (labels, titles, and axis markers).
- **Other Languages**: None detected.
---
### Final Notes
- The plot uses a **log-log scale** to emphasize multiplicative relationships.
- The absence of a legend requires inference based on color coding.
- The trend line and data points suggest a **power-law decay** of ρ with increasing τ.