# Technical Document Extraction: Github Data Plot
## 1. Component Isolation
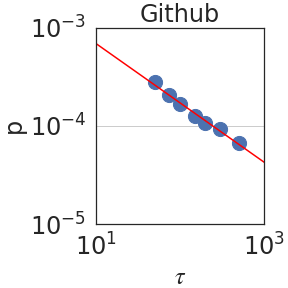
* **Header:** Contains the title "Github".
* **Main Chart Area:** A log-log scatter plot with a linear regression line.
* **Axes:**
* **Y-axis (Vertical):** Labeled "$p$".
* **X-axis (Horizontal):** Labeled "$\tau$".
## 2. Metadata and Labels
* **Title:** Github
* **Y-axis Label:** $p$ (representing probability or a related density metric).
* **X-axis Label:** $\tau$ (tau, representing a time interval or scale).
* **Y-axis Scale:** Logarithmic, ranging from $10^{-5}$ to $10^{-3}$. Major tick marks are at $10^{-5}$, $10^{-4}$, and $10^{-3}$.
* **X-axis Scale:** Logarithmic, ranging from $10^1$ to $10^3$. Major tick marks are at $10^1$ and $10^3$.
## 3. Data Series Analysis
### Trend Verification
* **Blue Data Points:** There are 8 circular blue data points. They follow a clear downward linear trend on the log-log scale, indicating a power-law relationship between $p$ and $\tau$.
* **Red Regression Line:** A solid red line passes through the center of the blue data points. The line slopes downward from the top-left toward the bottom-right.
### Data Point Extraction (Estimated from Log Scale)
The data points are clustered between $\tau \approx 50$ and $\tau \approx 700$.
| Point | $\tau$ (X-axis approx.) | $p$ (Y-axis approx.) |
| :--- | :--- | :--- |
| 1 | 60 | $3 \times 10^{-4}$ |
| 2 | 80 | $2.2 \times 10^{-4}$ |
| 3 | 100 | $1.8 \times 10^{-4}$ |
| 4 | 150 | $1.2 \times 10^{-4}$ |
| 5 | 200 | $1.0 \times 10^{-4}$ |
| 6 | 300 | $0.9 \times 10^{-4}$ |
| 7 | 500 | $0.7 \times 10^{-4}$ |
| 8 | 700 | $0.6 \times 10^{-4}$ |
## 4. Visual Components and Flow
* **Gridlines:** A single horizontal grey gridline is visible at the $p = 10^{-4}$ mark.
* **Relationship:** The plot illustrates that as $\tau$ increases, $p$ decreases. Because this is a straight line on a log-log plot, it represents a functional form of $p(\tau) \propto \tau^{-\alpha}$, where $\alpha$ is the absolute value of the slope of the red line.
* **Spatial Grounding:**
* The title "Github" is centered at the top.
* The Y-axis label "$p$" is centered vertically on the left.
* The X-axis label "$\tau$" is centered horizontally at the bottom.
* The data points are concentrated in the upper-middle to center-right region of the plot area.
## 5. Language Declaration
The text in this image is entirely in **English** (Title) and **Mathematical Notation** (Greek letter $\tau$, variable $p$, and scientific notation for powers of 10). No other languages are present.