## Chart: Kullback-Leibler Divergence
### Overview
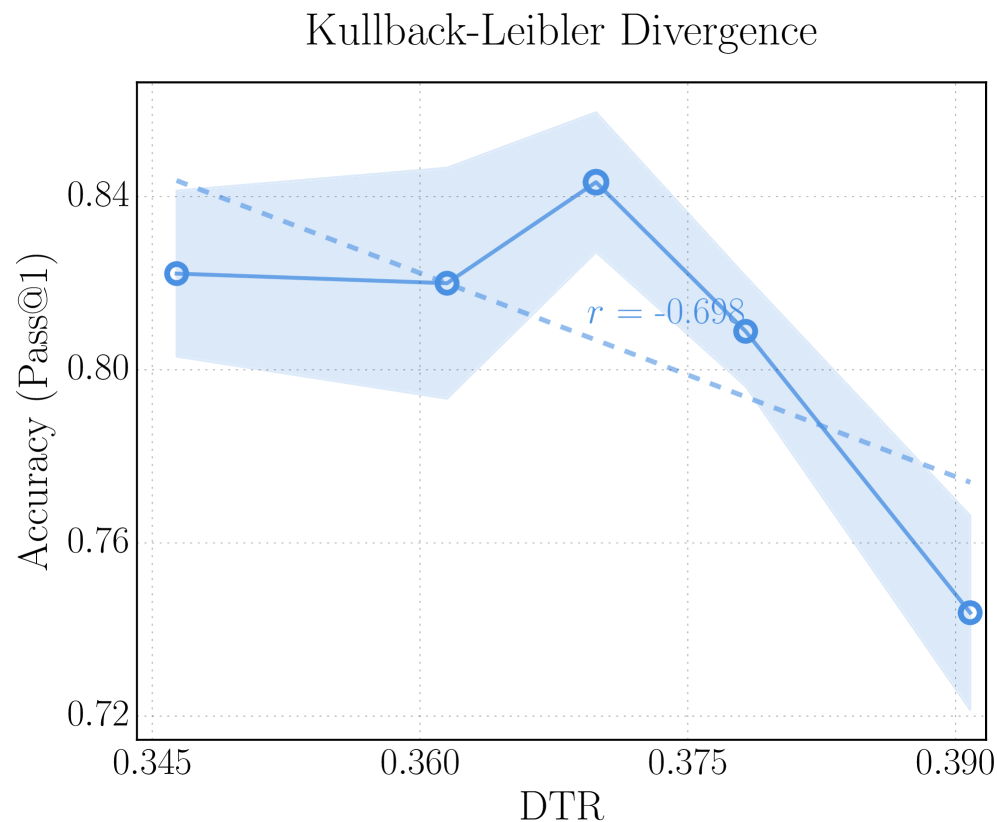
The image is a line chart titled "Kullback-Leibler Divergence". It plots "Accuracy (Pass@1)" on the y-axis against "DTR" on the x-axis. The chart displays a solid blue line with circular markers, representing the primary data series, along with a shaded blue region around the line, indicating uncertainty. A dashed blue line represents a secondary trend. The chart also includes the correlation coefficient 'r = -0.698'.
### Components/Axes
* **Title:** Kullback-Leibler Divergence
* **X-axis:**
* Label: DTR
* Scale: 0.345, 0.360, 0.375, 0.390
* **Y-axis:**
* Label: Accuracy (Pass@1)
* Scale: 0.72, 0.76, 0.80, 0.84
* **Data Series 1:** Solid blue line with circular markers and shaded region.
* **Data Series 2:** Dashed blue line.
* **Correlation Coefficient:** r = -0.698
### Detailed Analysis
* **Data Series 1 (Solid Blue Line):**
* Trend: Initially relatively flat, then increases, then decreases.
* Data Points:
* At DTR = 0.345, Accuracy = 0.825 (+/- 0.005)
* At DTR = 0.360, Accuracy = 0.825 (+/- 0.005)
* At DTR = 0.375, Accuracy = 0.842 (+/- 0.005)
* At DTR = 0.390, Accuracy = 0.809 (+/- 0.005)
* At DTR = 0.390, Accuracy = 0.745 (+/- 0.005)
* **Data Series 2 (Dashed Blue Line):**
* Trend: Decreasing.
* Approximate Data Points:
* At DTR = 0.345, Accuracy = 0.840 (+/- 0.005)
* At DTR = 0.390, Accuracy = 0.770 (+/- 0.005)
### Key Observations
* The solid blue line shows a peak in accuracy around DTR = 0.375.
* The dashed blue line shows a negative correlation between DTR and accuracy.
* The shaded region around the solid blue line indicates the uncertainty associated with the accuracy values.
* The correlation coefficient 'r = -0.698' suggests a moderate negative correlation between DTR and the dashed blue line's accuracy.
### Interpretation
The chart illustrates the relationship between DTR and accuracy, as measured by Pass@1. The solid blue line represents the observed accuracy, while the shaded region represents the uncertainty in those measurements. The dashed blue line represents a trend line, and the negative correlation coefficient suggests that as DTR increases, the trend line accuracy tends to decrease. The peak in the solid blue line indicates an optimal DTR value around 0.375 for maximizing accuracy. The divergence between the solid and dashed lines suggests that the actual accuracy deviates from the overall trend, particularly at DTR values around 0.375.