\n
## Line Chart with Confidence Interval: Kullback-Leibler Divergence vs. Accuracy
### Overview
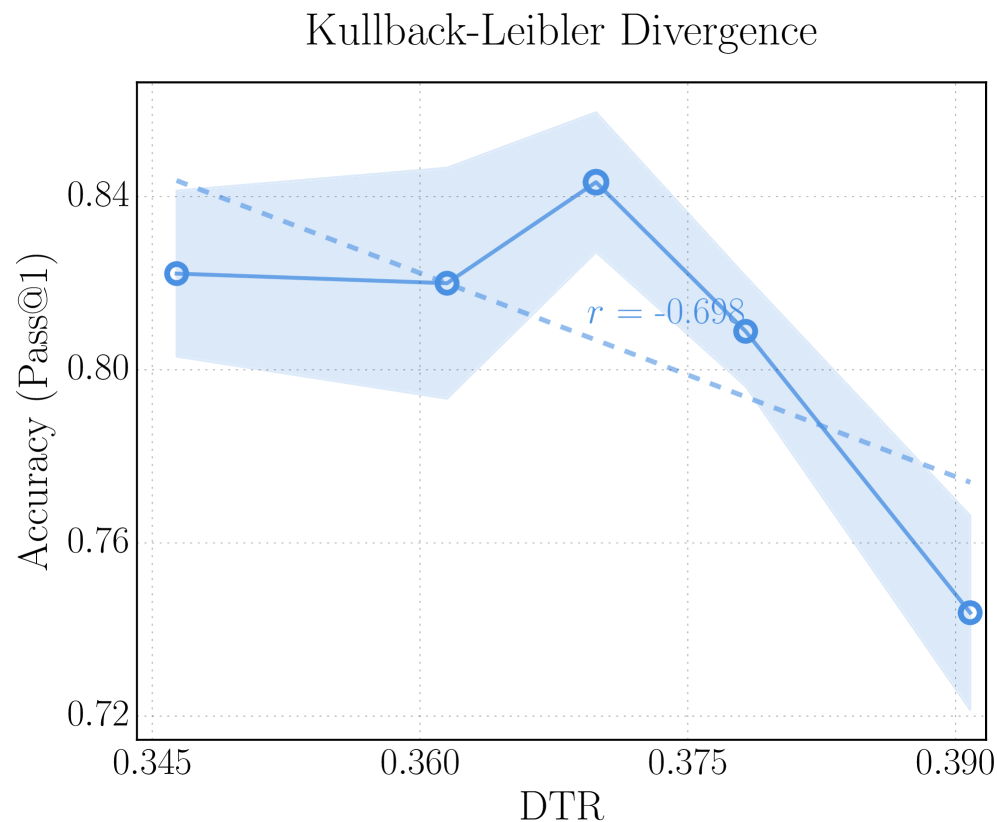
The image displays a line chart titled "Kullback-Leibler Divergence." It plots a metric called "Accuracy (Pass@1)" against "DTR" (likely an acronym for a specific divergence or distance metric). The chart includes a primary data series with a shaded confidence interval and a dashed trend line indicating a negative correlation.
### Components/Axes
* **Title:** "Kullback-Leibler Divergence" (centered at the top).
* **Y-Axis:** Labeled "Accuracy (Pass@1)". The scale runs from 0.72 to 0.84, with major tick marks at 0.72, 0.76, 0.80, and 0.84.
* **X-Axis:** Labeled "DTR". The scale runs from 0.345 to 0.390, with major tick marks at 0.345, 0.360, 0.375, and 0.390.
* **Data Series (Solid Blue Line with Circles):** A solid blue line connects five data points, each marked with a blue circle. This line is surrounded by a light blue shaded region representing a confidence interval or variance.
* **Trend Line (Dashed Blue Line):** A dashed blue line runs from the top-left to the bottom-right of the plot area, indicating the overall trend.
* **Correlation Annotation:** The text "r = -0.698" is placed near the center of the plot, adjacent to the dashed trend line, indicating the Pearson correlation coefficient.
### Detailed Analysis
**Data Points (Approximate Coordinates):**
The primary data series (solid line) shows the following approximate relationship between DTR (x) and Accuracy (y):
1. (0.345, 0.82)
2. (0.360, 0.82)
3. (0.370, 0.84) - This is the peak accuracy point.
4. (0.378, 0.81)
5. (0.390, 0.74)
**Trend Verification:**
* **Primary Data Series (Solid Line):** The line starts flat between the first two points, rises to a peak at the third point, and then slopes sharply downward for the final two points. The overall visual trend after the peak is a steep decline.
* **Trend Line (Dashed Line):** The dashed line slopes consistently downward from left to right, visually confirming the negative correlation stated by the annotation.
**Confidence Interval (Shaded Region):**
The light blue shaded area represents uncertainty around the primary data line. Its width varies:
* It is narrowest at the first data point (DTR ~0.345).
* It widens significantly around the peak (DTR ~0.370), suggesting greater variance or uncertainty in accuracy at this divergence level.
* It remains relatively wide for the final two points as accuracy drops.
### Key Observations
1. **Non-Monotonic Relationship:** Accuracy does not simply decrease with increasing DTR. It remains stable, peaks, and then falls sharply.
2. **Peak Performance:** The highest accuracy (≈0.84) occurs at an intermediate DTR value of approximately 0.370.
3. **Strong Negative Correlation:** Despite the initial peak, the overall trend is negative (r = -0.698), indicating that higher DTR values are generally associated with lower Pass@1 accuracy.
4. **Sharp Decline:** The most dramatic change is the steep drop in accuracy from ≈0.84 to ≈0.74 as DTR increases from ~0.370 to 0.390.
5. **Uncertainty at Peak:** The confidence interval is widest around the peak accuracy point, indicating this measurement may have the highest variability.
### Interpretation
This chart investigates the relationship between a divergence metric (DTR) and a model's top-1 accuracy (Pass@1). The Kullback-Leibler Divergence in the title suggests DTR might be a measure of difference between probability distributions, perhaps comparing a model's output distribution to a target distribution.
The data suggests a **trade-off with an optimal point**. Very low DTR (high similarity) does not yield the best accuracy. Instead, accuracy peaks at a moderate DTR value (~0.370), implying that a certain level of "divergence" or difference in the measured distributions is beneficial for model performance. However, beyond this optimal point, further increases in divergence are strongly detrimental, leading to a rapid decline in accuracy.
The negative correlation (r = -0.698) summarizes the general tendency, but the non-linear shape of the solid line is the critical finding. It warns against assuming a simple linear relationship and highlights the importance of the intermediate DTR zone for maximizing performance. The widening confidence interval at the peak suggests that operating near this optimal point may also introduce more variability in outcomes.