## Line Chart: Kullback-Leibler Divergence
### Overview
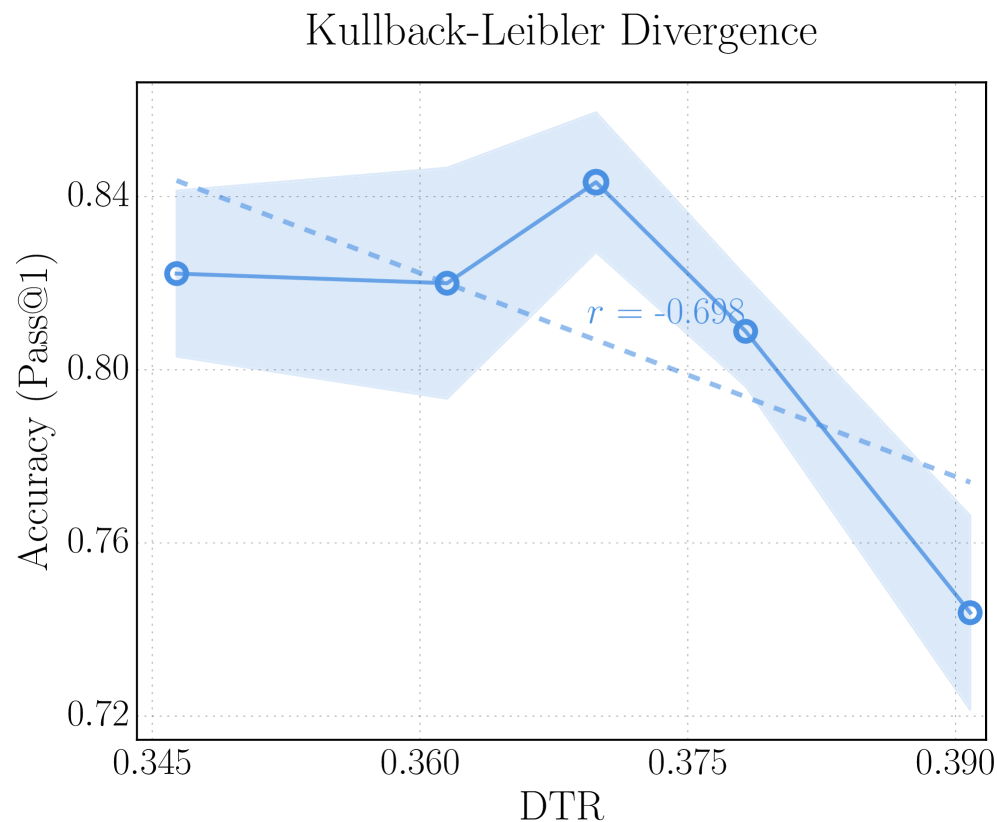
The chart illustrates the relationship between DTR (x-axis) and Accuracy (Pass@1, y-axis) with a blue line and shaded confidence interval. A negative correlation (r = -0.698) is annotated, indicating an inverse relationship between the variables.
### Components/Axes
- **X-axis (DTR)**: Labeled "DTR" with values ranging from 0.345 to 0.390 in increments of 0.015.
- **Y-axis (Accuracy)**: Labeled "Accuracy (Pass@1)" with values from 0.72 to 0.84 in increments of 0.02.
- **Legend**: Positioned at the top, labeled "Pass@1" with a blue color matching the line and shaded area.
- **Shaded Area**: Represents a confidence interval (likely 95%) around the blue line.
### Detailed Analysis
- **Data Points**:
- (0.345, 0.83)
- (0.360, 0.83)
- (0.375, 0.84)
- (0.390, 0.73)
- **Trend**: The blue line starts at 0.83 accuracy for DTR=0.345, remains stable until DTR=0.375 (peak at 0.84), then sharply declines to 0.73 at DTR=0.390. The shaded area follows the line’s trajectory, widening slightly near the peak.
### Key Observations
1. **Negative Correlation**: The r = -0.698 value confirms a strong inverse relationship between DTR and accuracy.
2. **Peak Performance**: Accuracy peaks at DTR=0.375 (0.84), suggesting an optimal DTR value before performance degrades.
3. **Confidence Interval**: The shaded area indicates variability in accuracy, with the widest spread near the peak (DTR=0.375).
### Interpretation
The chart demonstrates that increasing DTR initially stabilizes or slightly improves accuracy, but beyond DTR=0.375, performance drops significantly. The negative correlation implies that higher DTR values may introduce noise or overfitting, reducing model reliability. The shaded confidence interval highlights uncertainty in accuracy estimates, particularly at the peak DTR value. This suggests a trade-off between model complexity (DTR) and generalization performance (Pass@1), with an optimal DTR range likely between 0.345 and 0.375.