## Line Chart: Accuracy vs. Attack Ratio for Federated Learning Algorithms
### Overview
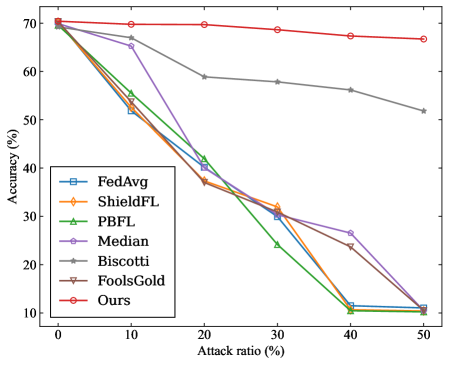
This line chart depicts the relationship between the attack ratio (percentage) and the accuracy (percentage) of several federated learning algorithms. The chart compares the robustness of these algorithms against adversarial attacks, where the attack ratio represents the proportion of malicious participants in the federated learning system.
### Components/Axes
* **X-axis:** "Attack ratio (%)" - Ranges from 0% to 50%, with markers at 0, 10, 20, 30, 40, and 50.
* **Y-axis:** "Accuracy (%)" - Ranges from 0% to 70%, with markers at 10, 20, 30, 40, 50, 60, and 70.
* **Legend (bottom-left):** Lists the algorithms being compared:
* FedAvg (Blue, square markers)
* ShieldFL (Orange, triangle markers)
* PBFL (Green, triangle markers)
* Median (Purple, circle markers)
* Biscotti (Brown, square markers)
* FoolsGold (Red, triangle markers)
* Ours (Red, circle markers)
### Detailed Analysis
Here's a breakdown of each algorithm's performance based on the chart:
* **Ours (Red, circle markers):** Starts at approximately 69% accuracy at 0% attack ratio and remains relatively stable, decreasing slightly to approximately 67% at 50% attack ratio. This line is nearly horizontal.
* **FoolsGold (Red, triangle markers):** Starts at approximately 69% accuracy at 0% attack ratio and decreases to approximately 64% at 50% attack ratio. This line has a slight negative slope.
* **Biscotti (Brown, square markers):** Starts at approximately 68% accuracy at 0% attack ratio and decreases to approximately 56% at 50% attack ratio. This line has a moderate negative slope.
* **Median (Purple, circle markers):** Starts at approximately 68% accuracy at 0% attack ratio and decreases sharply to approximately 24% at 50% attack ratio. This line has a steep negative slope.
* **PBFL (Green, triangle markers):** Starts at approximately 66% accuracy at 0% attack ratio and decreases very sharply to approximately 10% at 50% attack ratio. This line has a very steep negative slope.
* **ShieldFL (Orange, triangle markers):** Starts at approximately 64% accuracy at 0% attack ratio and decreases sharply to approximately 30% at 50% attack ratio. This line has a steep negative slope.
* **FedAvg (Blue, square markers):** Starts at approximately 64% accuracy at 0% attack ratio and decreases sharply to approximately 10% at 50% attack ratio. This line has a very steep negative slope.
### Key Observations
* The "Ours" algorithm demonstrates the highest and most stable accuracy across all attack ratios.
* FedAvg, PBFL, and ShieldFL are the most vulnerable to attacks, experiencing a significant drop in accuracy as the attack ratio increases.
* FoolsGold and Biscotti show intermediate vulnerability, with a moderate decrease in accuracy.
* Median shows a significant drop in accuracy, but is less vulnerable than FedAvg, PBFL, and ShieldFL.
* There is a clear trend of decreasing accuracy as the attack ratio increases for all algorithms except "Ours".
### Interpretation
The data suggests that the "Ours" algorithm is significantly more robust to adversarial attacks in a federated learning setting compared to the other algorithms tested. The near-horizontal line representing "Ours" indicates that its performance is largely unaffected by the presence of malicious participants. The steep declines in accuracy for algorithms like FedAvg, PBFL, and ShieldFL highlight their vulnerability to attacks, suggesting that they are easily compromised by even a moderate proportion of malicious actors.
The chart demonstrates the importance of developing robust federated learning algorithms that can maintain accuracy and reliability in the face of adversarial attacks. The "Ours" algorithm appears to offer a promising solution, potentially due to its inherent design or defense mechanisms. The differences in performance between the algorithms likely stem from their underlying approaches to aggregation, privacy preservation, or attack detection. Further investigation into the specific mechanisms of each algorithm would be necessary to fully understand the reasons for these observed differences.