## Line Chart: Accuracy vs. Attack Ratio for Federated Learning Methods
### Overview
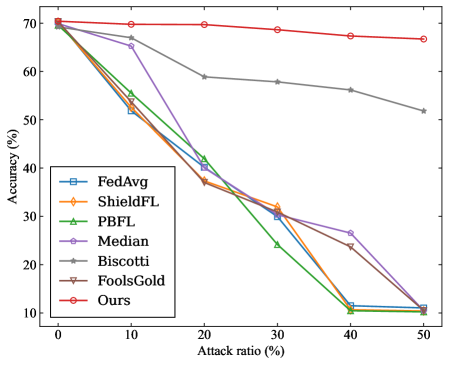
The image is a line chart comparing the performance (accuracy) of seven different federated learning methods or aggregation strategies as the ratio of adversarial attacks increases. The chart demonstrates how each method's accuracy degrades under increasing levels of attack, with one method ("Ours") showing significantly greater resilience.
### Components/Axes
* **Chart Type:** Multi-line chart with markers.
* **X-Axis (Horizontal):**
* **Label:** `Attack ratio (%)`
* **Scale:** Linear, from 0 to 50.
* **Tick Marks:** 0, 10, 20, 30, 40, 50.
* **Y-Axis (Vertical):**
* **Label:** `Accuracy (%)`
* **Scale:** Linear, from 10 to 70.
* **Tick Marks:** 10, 20, 30, 40, 50, 60, 70.
* **Legend:**
* **Position:** Bottom-left corner of the plot area.
* **Content (with corresponding line color and marker):**
1. `FedAvg` - Blue line, square marker (□).
2. `ShieldFL` - Orange line, diamond marker (◇).
3. `PBFL` - Green line, upward-pointing triangle marker (△).
4. `Median` - Purple line, circle marker (○).
5. `Biscotti` - Gray line, star marker (☆).
6. `FoolsGold` - Brown line, downward-pointing triangle marker (▽).
7. `Ours` - Red line, circle marker (○).
### Detailed Analysis
The chart plots accuracy (%) against attack ratio (%). All methods start at approximately the same high accuracy (~70%) when the attack ratio is 0%. As the attack ratio increases, the performance of most methods declines sharply, while one remains stable.
**Trend Verification & Data Point Extraction (Approximate Values):**
1. **Ours (Red line, circle marker):**
* **Trend:** Nearly flat, showing minimal degradation.
* **Points:** (0%, ~70%), (10%, ~70%), (20%, ~70%), (30%, ~69%), (40%, ~68%), (50%, ~67%).
2. **Biscotti (Gray line, star marker):**
* **Trend:** Gradual, steady decline.
* **Points:** (0%, ~70%), (10%, ~67%), (20%, ~59%), (30%, ~58%), (40%, ~56%), (50%, ~52%).
3. **Median (Purple line, circle marker):**
* **Trend:** Steep decline until 40%, then a slight plateau.
* **Points:** (0%, ~70%), (10%, ~67%), (20%, ~40%), (30%, ~32%), (40%, ~27%), (50%, ~11%).
4. **FoolsGold (Brown line, downward triangle marker):**
* **Trend:** Very steep, consistent decline.
* **Points:** (0%, ~70%), (10%, ~52%), (20%, ~37%), (30%, ~32%), (40%, ~24%), (50%, ~11%).
5. **FedAvg (Blue line, square marker):**
* **Trend:** Very steep, consistent decline, closely tracking ShieldFL and PBFL.
* **Points:** (0%, ~70%), (10%, ~53%), (20%, ~39%), (30%, ~30%), (40%, ~11%), (50%, ~11%).
6. **ShieldFL (Orange line, diamond marker):**
* **Trend:** Very steep, consistent decline, closely tracking FedAvg and PBFL.
* **Points:** (0%, ~70%), (10%, ~53%), (20%, ~38%), (30%, ~32%), (40%, ~11%), (50%, ~11%).
7. **PBFL (Green line, upward triangle marker):**
* **Trend:** Very steep, consistent decline, closely tracking FedAvg and ShieldFL.
* **Points:** (0%, ~70%), (10%, ~55%), (20%, ~42%), (30%, ~24%), (40%, ~11%), (50%, ~11%).
### Key Observations
1. **Clear Performance Stratification:** At attack ratios above 10%, the methods separate into three distinct performance tiers:
* **Top Tier:** "Ours" (Red) maintains accuracy above 65%.
* **Middle Tier:** "Biscotti" (Gray) degrades gradually but stays above 50%.
* **Lower Tier:** All other methods (FedAvg, ShieldFL, PBFL, Median, FoolsGold) experience catastrophic failure, converging to ~11% accuracy at 40-50% attack ratio.
2. **Critical Threshold:** A significant performance drop for the lower-tier methods occurs between 10% and 20% attack ratio.
3. **Convergence at High Attack:** At 40% and 50% attack ratios, five of the seven methods (FedAvg, ShieldFL, PBFL, Median, FoolsGold) cluster at the bottom of the chart with nearly identical, very low accuracy (~11%).
4. **Anomaly:** The "Median" method (Purple) shows a less severe drop between 30% and 40% compared to its steep fall from 10% to 30%, but it ultimately fails at 50%.
### Interpretation
This chart presents a comparative evaluation of robustness in federated learning systems under adversarial (Byzantine) attacks. The "Attack ratio (%)" likely represents the proportion of malicious clients or poisoned updates in the system.
* **What the data suggests:** The method labeled "Ours" demonstrates superior robustness. Its near-horizontal line indicates that its accuracy is largely unaffected by the presence of adversarial participants, up to a 50% attack ratio. This suggests a highly effective defense mechanism.
* **Relationship between elements:** The steep negative slopes for most baseline methods (FedAvg, ShieldFL, PBFL, FoolsGold) illustrate their vulnerability; their performance is directly and negatively correlated with the attack strength. "Biscotti" shows moderate resilience, degrading linearly but not catastrophically. The clustering of multiple methods at ~11% accuracy at high attack ratios may represent a baseline or random-guess performance level for the underlying task when the aggregation is completely compromised.
* **Notable Implications:** The chart makes a strong visual argument for the efficacy of the proposed method ("Ours"). It highlights that traditional aggregation methods (like FedAvg) and some existing robust methods can fail completely under significant adversarial pressure, while the new approach maintains high utility. The clear separation between "Ours" and all others, especially after the 10% attack mark, is the central finding.