## Line Graph: Accuracy vs. Attack Ratio
### Overview
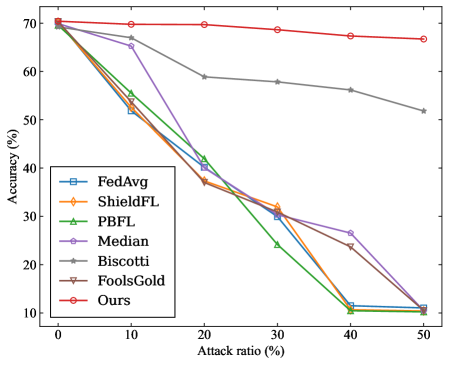
The image depicts a line graph comparing the accuracy performance of multiple machine learning methods under varying attack ratios. The graph shows seven distinct data series (methods) plotted against two axes: attack ratio (%) on the x-axis (0-50%) and accuracy (%) on the y-axis (10-70%). All methods demonstrate declining accuracy as attack ratio increases, with one notable exception.
### Components/Axes
- **Y-axis**: Accuracy (%) ranging from 10% to 70% in 10% increments
- **X-axis**: Attack ratio (%) ranging from 0% to 50% in 10% increments
- **Legend**: Located in bottom-left quadrant, containing seven entries:
- FedAvg (blue square)
- ShieldFL (orange diamond)
- PBFL (green triangle)
- Median (purple pentagon)
- Biscotti (gray star)
- FoolsGold (brown inverted triangle)
- Ours (red circle)
### Detailed Analysis
1. **Ours (red circle)**:
- Maintains near-constant accuracy (~68-70%) across all attack ratios
- Shows minimal decline (only ~2% drop from 0% to 50% attack ratio)
- Spatial grounding: Topmost line throughout the graph
2. **FedAvg (blue square)**:
- Starts at ~68% accuracy at 0% attack ratio
- Sharp decline to ~12% at 50% attack ratio
- Crosses below ShieldFL at ~20% attack ratio
3. **ShieldFL (orange diamond)**:
- Begins at ~68% accuracy
- Gradual decline to ~10% at 50% attack ratio
- Maintains second-highest performance until ~30% attack ratio
4. **PBFL (green triangle)**:
- Starts at ~68% accuracy
- Steep decline to ~10% at 50% attack ratio
- Crosses below FedAvg at ~15% attack ratio
5. **Median (purple pentagon)**:
- Begins at ~68% accuracy
- Moderate decline to ~12% at 50% attack ratio
- Shows more gradual slope than FedAvg/PBFL
6. **Biscotti (gray star)**:
- Starts at ~68% accuracy
- Gradual decline to ~52% at 50% attack ratio
- Maintains third-highest performance throughout
7. **FoolsGold (brown inverted triangle)**:
- Starts at ~68% accuracy
- Steep decline to ~10% at 50% attack ratio
- Crosses below PBFL at ~25% attack ratio
### Key Observations
- **Robustness disparity**: "Ours" demonstrates exceptional resilience, maintaining >65% accuracy even at 50% attack ratio
- **Performance clustering**: FedAvg, ShieldFL, PBFL, and FoolsGold show similar vulnerability patterns with steep accuracy declines
- **Biscotti's moderate performance**: Unique among methods for maintaining >50% accuracy at 50% attack ratio
- **Attack sensitivity**: All methods except "Ours" experience >50% accuracy loss between 0% and 50% attack ratios
### Interpretation
The data suggests "Ours" implements a fundamentally different approach to model robustness compared to other methods. Its near-constant accuracy curve implies either:
1. Superior adversarial training techniques
2. More effective input sanitization mechanisms
3. Better model architecture for handling corrupted data
The steep declines in other methods indicate they rely heavily on clean data distributions. Biscotti's moderate performance suggests some middle-ground approach, possibly combining robustness with computational efficiency. The clustering of FedAvg, ShieldFL, PBFL, and FoolsGold implies these methods share similar architectural limitations in handling adversarial inputs.
This graph highlights critical trade-offs in federated learning systems between model performance and security. The stark contrast between "Ours" and other methods warrants further investigation into its specific defensive mechanisms and potential implementation costs.