## Line Graph: Separation between true and false statements across layers
### Overview
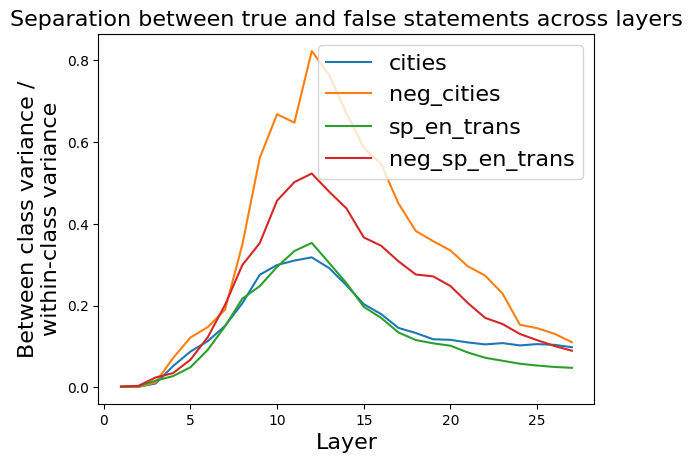
The graph illustrates the relationship between between-class variance and within-class variance across 26 layers (0-25) for four categories: cities, neg_cities, sp_en_trans, and neg_sp_en_trans. The y-axis represents the ratio of between-class variance to within-class variance, while the x-axis represents layer depth.
### Components/Axes
- **X-axis (Layer)**: Integer scale from 0 to 25
- **Y-axis (Between class variance / within-class variance)**: Continuous scale from 0.0 to 0.8
- **Legend**: Located in top-right corner with four color-coded categories:
- Blue: cities
- Orange: neg_cities
- Green: sp_en_trans
- Red: neg_sp_en_trans
### Detailed Analysis
1. **neg_cities (orange line)**:
- Peaks at approximately 0.8 between-class variance ratio at layer 12
- Sharp decline after layer 12, reaching ~0.15 by layer 25
- Steepest ascent between layers 5-10
2. **neg_sp_en_trans (red line)**:
- Peaks at ~0.55 between-class variance at layer 11
- Gradual decline to ~0.1 by layer 25
- Slight plateau between layers 15-20
3. **cities (blue line)**:
- Peaks at ~0.3 between-class variance at layer 11
- Gradual decline to ~0.05 by layer 25
- Smoother curve compared to negated categories
4. **sp_en_trans (green line)**:
- Peaks at ~0.35 between-class variance at layer 12
- Gradual decline to ~0.02 by layer 25
- Most gradual overall trajectory
### Key Observations
- Negated categories (neg_cities, neg_sp_en_trans) consistently show higher between-class variance ratios than their non-negated counterparts
- All lines follow a similar "rise-peak-fall" pattern, suggesting diminishing discriminative power in deeper layers
- neg_cities demonstrates the most pronounced separation between classes (highest peak)
- sp_en_trans shows the most gradual decline after its peak
- All categories converge toward similar low values (~0.05-0.1) by layer 25
### Interpretation
The data suggests that negated categories (neg_cities, neg_sp_en_trans) maintain stronger class separation across layers compared to their non-negated counterparts. This could indicate that:
1. False statements (negated categories) are more easily distinguishable by the model's representations
2. The model's discriminative power for true statements (cities, sp_en_trans) diminishes more rapidly in deeper layers
3. Layer 11-12 represents an optimal depth for distinguishing negated categories, while layer 12 is optimal for sp_en_trans
The consistent peak patterns across all lines suggest a systematic relationship between layer depth and class separation capability, with negated categories maintaining advantages throughout the network architecture.