## Grid Table: Numeric Data with Highlighted Cells
### Overview
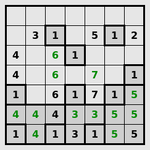
The image depicts a 6x7 grid of numerical values, with specific cells highlighted in gray or green. The grid contains integers ranging from 1 to 7, with no explicit axis labels, legends, or contextual annotations. Highlighted cells appear to emphasize certain values, though no explicit key or legend is provided.
### Components/Axes
- **Grid Structure**:
- 6 rows (labeled 1–6 vertically, though no explicit row labels are present).
- 7 columns (no explicit column labels).
- **Highlighted Cells**:
- **Gray Highlights**: Cells containing the value `1` in positions:
- Row 1, Column 2
- Row 1, Column 4
- Row 3, Column 7
- Row 4, Column 1
- Row 4, Column 5
- **Green Highlights**: Cells containing the value `6` in positions:
- Row 2, Column 2
- Row 3, Column 2
### Detailed Analysis
- **Value Distribution**:
- **1**: Appears 6 times (most frequent value).
- **3**: Appears 4 times.
- **4**: Appears 5 times.
- **5**: Appears 6 times.
- **6**: Appears 2 times (highlighted).
- **7**: Appears 2 times.
- **Spatial Patterns**:
- **Column 1**: Contains `3`, `4`, `4`, `1`, `4`, `1` (values 1 and 4 dominate).
- **Column 2**: Contains `1` (gray), `6` (green), `6` (green), `4`, `4`, `4` (values 4 and 6 cluster here).
- **Column 5**: Contains `7`, `1` (gray), `3`, `1` (gray), `3`, `5` (values 1 and 3 appear in highlighted cells).
- **Row 5**: Contains `4`, `4`, `4`, `3`, `3`, `5`, `5` (values 4 and 3 cluster in the first four columns).
### Key Observations
1. **Highlights**:
- Gray highlights (`1`) are concentrated in the first and fourth columns, suggesting a possible emphasis on lower values in these regions.
- Green highlights (`6`) are isolated in Column 2, rows 2–3, indicating a localized emphasis on this value.
2. **Repetition**:
- The value `5` appears most frequently in the final two columns (columns 6–7), suggesting a possible trend or category.
- The value `4` dominates the fifth row, potentially indicating a categorical or grouped data point.
### Interpretation
The grid likely represents a frequency matrix, heatmap, or categorical distribution. The highlights may denote:
- **Gray (`1`)**: Low-frequency or baseline values.
- **Green (`6`)**: High-frequency or critical values.
The repetition of `4` and `5` in specific rows/columns suggests structured groupings or categories. The absence of axis labels or legends limits contextual interpretation, but the spatial clustering of values implies intentional categorization.
## Notes on Uncertainty
- No explicit axis titles, legends, or contextual text are present.
- Highlighting conventions (gray vs. green) are inferred from visual patterns, as no legend is provided.
- The grid’s purpose (e.g., frequency, priority, error rates) remains speculative without additional metadata.