## Line Chart: Accuracy vs. Iteration
### Overview
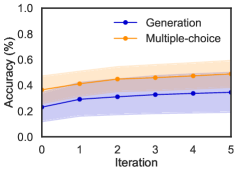
The image is a line chart comparing the accuracy of two methods, "Generation" and "Multiple-choice," across iterations. The chart displays accuracy (in percentage) on the y-axis and iteration number on the x-axis. Shaded regions around each line indicate the uncertainty or variability in the accuracy.
### Components/Axes
* **X-axis:** Iteration (labeled from 0 to 5)
* **Y-axis:** Accuracy (%) (labeled from 0.0 to 1.0, incrementing by 0.2)
* **Legend:** Located in the top-right corner.
* Blue line with circles: "Generation"
* Orange line with circles: "Multiple-choice"
### Detailed Analysis
* **Generation (Blue):**
* Trend: The accuracy increases from iteration 0 to iteration 5, but the rate of increase slows down.
* Data Points:
* Iteration 0: Accuracy ≈ 0.23
* Iteration 1: Accuracy ≈ 0.29
* Iteration 2: Accuracy ≈ 0.31
* Iteration 3: Accuracy ≈ 0.33
* Iteration 4: Accuracy ≈ 0.34
* Iteration 5: Accuracy ≈ 0.35
* **Multiple-choice (Orange):**
* Trend: The accuracy increases from iteration 0 to iteration 5, but the rate of increase slows down.
* Data Points:
* Iteration 0: Accuracy ≈ 0.37
* Iteration 1: Accuracy ≈ 0.41
* Iteration 2: Accuracy ≈ 0.45
* Iteration 3: Accuracy ≈ 0.46
* Iteration 4: Accuracy ≈ 0.47
* Iteration 5: Accuracy ≈ 0.50
### Key Observations
* The "Multiple-choice" method consistently shows higher accuracy than the "Generation" method across all iterations.
* Both methods exhibit diminishing returns in accuracy as the number of iterations increases.
* The shaded regions around the lines suggest that the "Generation" method has a wider range of accuracy values compared to the "Multiple-choice" method, especially at lower iterations.
### Interpretation
The chart suggests that the "Multiple-choice" method is more accurate than the "Generation" method for the task being evaluated. The diminishing returns in accuracy with increasing iterations indicate that there may be a limit to how much improvement can be achieved through further iterations for both methods. The wider shaded region for the "Generation" method implies that its performance is more variable or less stable compared to the "Multiple-choice" method. This could be due to the nature of the generation process, which might be more sensitive to variations in the input or model parameters.