\n
## Line Chart: Accuracy vs. Iteration
### Overview
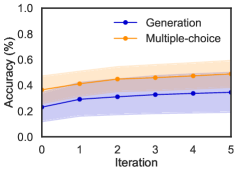
This image presents a line chart comparing the accuracy of two methods – "Generation" and "Multiple-choice" – across five iterations. The chart displays the mean accuracy and a shaded region representing the standard deviation or confidence interval around the mean.
### Components/Axes
* **X-axis:** "Iteration", ranging from 0 to 5.
* **Y-axis:** "Accuracy (%)", ranging from 0.0 to 1.0.
* **Data Series 1:** "Generation" – represented by a blue line with circular markers.
* **Data Series 2:** "Multiple-choice" – represented by an orange line with circular markers.
* **Legend:** Located at the top-center of the chart, identifying the two data series by color and label.
* **Shaded Regions:** Blue shaded region around the "Generation" line, and orange shaded region around the "Multiple-choice" line, indicating variability.
### Detailed Analysis
**Generation (Blue Line):**
The blue line representing "Generation" accuracy starts at approximately 0.25 at Iteration 0. It shows a slight upward trend, reaching a peak of around 0.35 at Iteration 2, then plateaus and slightly declines to approximately 0.32 at Iteration 4 and 0.30 at Iteration 5. The shaded blue region indicates a standard deviation or confidence interval, varying between approximately 0.15 and 0.45 across the iterations.
**Multiple-choice (Orange Line):**
The orange line representing "Multiple-choice" accuracy begins at approximately 0.42 at Iteration 0. It exhibits a decreasing trend, falling to around 0.40 at Iteration 1, 0.38 at Iteration 2, 0.36 at Iteration 3, and stabilizing around 0.35 at Iteration 4 and 5. The shaded orange region shows a standard deviation or confidence interval, ranging from approximately 0.30 to 0.55 across the iterations.
**Data Points (Approximate):**
| Iteration | Generation Accuracy (%) | Multiple-choice Accuracy (%) |
|---|---|---|
| 0 | 0.25 | 0.42 |
| 1 | 0.28 | 0.40 |
| 2 | 0.35 | 0.38 |
| 3 | 0.33 | 0.36 |
| 4 | 0.32 | 0.35 |
| 5 | 0.30 | 0.35 |
### Key Observations
* The "Generation" method shows a slight initial improvement in accuracy, but then plateaus.
* The "Multiple-choice" method consistently outperforms "Generation" in terms of accuracy, but its accuracy decreases over iterations.
* The confidence intervals (shaded regions) overlap significantly, suggesting that the difference in accuracy between the two methods may not be statistically significant.
* Both methods exhibit a relatively narrow range of accuracy, with "Multiple-choice" staying between approximately 0.30 and 0.55, and "Generation" between approximately 0.15 and 0.45.
### Interpretation
The data suggests that while the "Multiple-choice" method starts with a higher accuracy, both methods show limited improvement with increasing iterations. The decreasing trend in "Multiple-choice" accuracy could indicate overfitting or a saturation point where further iterations do not yield significant gains. The plateauing of "Generation" accuracy suggests that the method may have reached its performance limit. The overlapping confidence intervals imply that the observed differences in accuracy might be due to random variation rather than a true difference in the effectiveness of the two methods. Further investigation with a larger dataset or different evaluation metrics might be needed to draw more definitive conclusions. The chart demonstrates the performance of two different approaches over a series of iterations, highlighting their respective strengths and weaknesses.