## Line Graph: Accuracy Comparison Across Iterations
### Overview
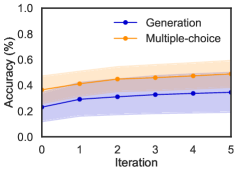
The image depicts a line graph comparing the accuracy of two methods ("Generation" and "Multiple-choice") over five iterations. The y-axis represents accuracy as a percentage (0–100%), and the x-axis represents iterations (0–5). Both data series show upward trends, with "Multiple-choice" consistently outperforming "Generation" across all iterations.
### Components/Axes
- **X-axis (Horizontal)**: Labeled "Iteration" with markers at 0, 1, 2, 3, 4, 5.
- **Y-axis (Vertical)**: Labeled "Accuracy (%)" with markers at 0.0, 0.2, 0.4, 0.6, 0.8, 1.0.
- **Legend**: Located in the top-right corner, with:
- **Blue line**: "Generation" (solid line with shaded uncertainty band).
- **Orange line**: "Multiple-choice" (solid line with shaded uncertainty band).
### Detailed Analysis
1. **Generation (Blue Line)**:
- Starts at ~0.25% accuracy at iteration 0.
- Increases gradually to ~0.35% by iteration 5.
- Uncertainty band (shaded blue) widens slightly over iterations, indicating increasing variability.
2. **Multiple-choice (Orange Line)**:
- Starts at ~0.35% accuracy at iteration 0.
- Increases steadily to ~0.5% by iteration 5.
- Uncertainty band (shaded orange) remains relatively narrow, suggesting stable performance.
3. **Trends**:
- Both lines show positive slopes, but "Multiple-choice" maintains a higher accuracy throughout.
- The gap between the two lines widens slightly from iteration 0 to 5 (~0.1% difference at start vs. ~0.15% at end).
### Key Observations
- "Multiple-choice" outperforms "Generation" by ~10–15% across all iterations.
- Uncertainty bands suggest "Generation" has higher variability in results compared to "Multiple-choice."
- No data points fall outside the shaded uncertainty regions.
### Interpretation
The graph demonstrates that the "Multiple-choice" method consistently achieves higher accuracy than "Generation" as iterations increase. The widening gap suggests that "Multiple-choice" may be more robust or better suited for the task being measured. The uncertainty bands highlight that "Generation" results are less reliable, potentially due to higher sensitivity to input variations or model instability. This could imply that "Multiple-choice" is a preferable approach for applications requiring consistent performance, while "Generation" might require further optimization or regularization to reduce variability.