## Horizontal Bar Chart: Information Category Presence Across Model Cards
### Overview
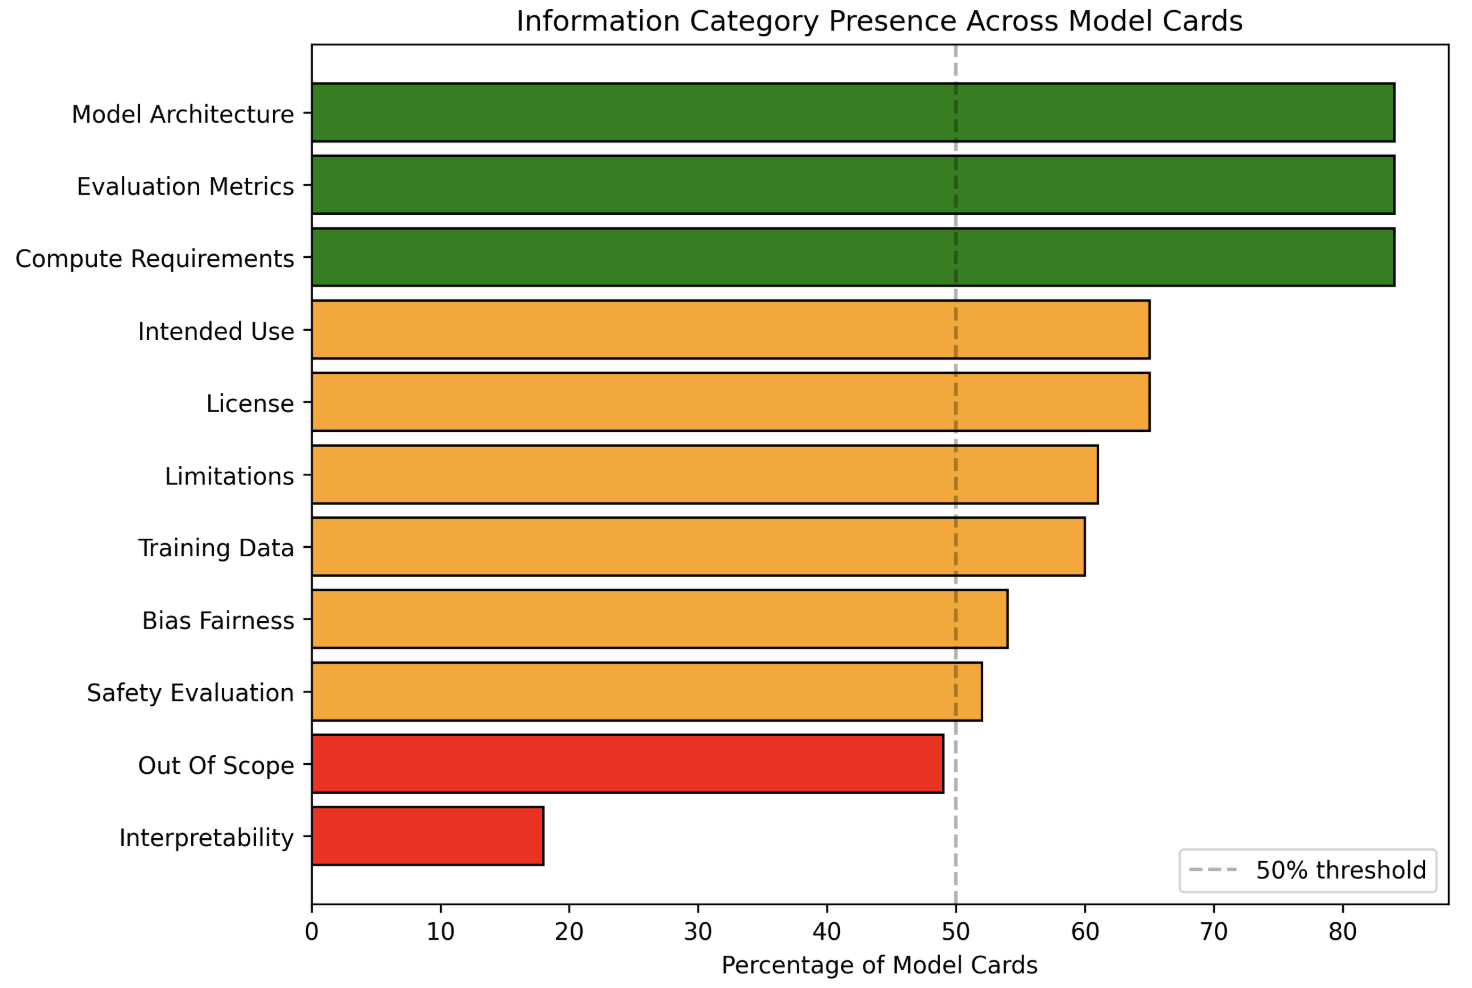
The image is a horizontal bar chart displaying the percentage of model cards that include specific information categories. The categories are listed on the vertical axis, and the percentage of model cards is on the horizontal axis. A vertical dashed line indicates a 50% threshold. The bars are colored green, orange, and red, with green indicating high presence, orange indicating moderate presence, and red indicating low presence.
### Components/Axes
* **Title:** Information Category Presence Across Model Cards
* **Horizontal Axis:** Percentage of Model Cards, ranging from 0% to 80% in increments of 10%.
* **Vertical Axis:** Information Categories (Model Architecture, Evaluation Metrics, Compute Requirements, Intended Use, License, Limitations, Training Data, Bias Fairness, Safety Evaluation, Out Of Scope, Interpretability).
* **Legend:** "50% threshold" represented by a dashed gray line.
* **Bar Colors:**
* Green: Model Architecture, Evaluation Metrics, Compute Requirements
* Orange: Intended Use, License, Limitations, Training Data, Bias Fairness, Safety Evaluation
* Red: Out Of Scope, Interpretability
### Detailed Analysis
The chart presents the percentage of model cards that include each information category.
* **Model Architecture:** Approximately 83% (Green)
* **Evaluation Metrics:** Approximately 82% (Green)
* **Compute Requirements:** Approximately 80% (Green)
* **Intended Use:** Approximately 65% (Orange)
* **License:** Approximately 64% (Orange)
* **Limitations:** Approximately 60% (Orange)
* **Training Data:** Approximately 58% (Orange)
* **Bias Fairness:** Approximately 54% (Orange)
* **Safety Evaluation:** Approximately 51% (Orange)
* **Out Of Scope:** Approximately 45% (Red)
* **Interpretability:** Approximately 18% (Red)
### Key Observations
* Model Architecture, Evaluation Metrics, and Compute Requirements are present in over 80% of model cards.
* Intended Use, License, Limitations, Training Data, Bias Fairness, and Safety Evaluation are present in between 50% and 65% of model cards.
* Out Of Scope and Interpretability are present in less than 50% of model cards.
* Interpretability has the lowest presence, at approximately 18%.
### Interpretation
The data suggests that certain information categories, such as Model Architecture, Evaluation Metrics, and Compute Requirements, are considered standard and are consistently included in model cards. Other categories, like Intended Use, License, and Limitations, are included in a moderate percentage of model cards. Notably, information regarding "Out Of Scope" and "Interpretability" is less frequently included, with "Interpretability" being the least represented category. This could indicate a lack of emphasis on these aspects in model documentation or potential challenges in defining and communicating them effectively. The 50% threshold line provides a visual reference for quickly assessing which categories are included in a majority of model cards.