## Horizontal Bar Chart: Information Category Presence Across Model Cards
### Overview
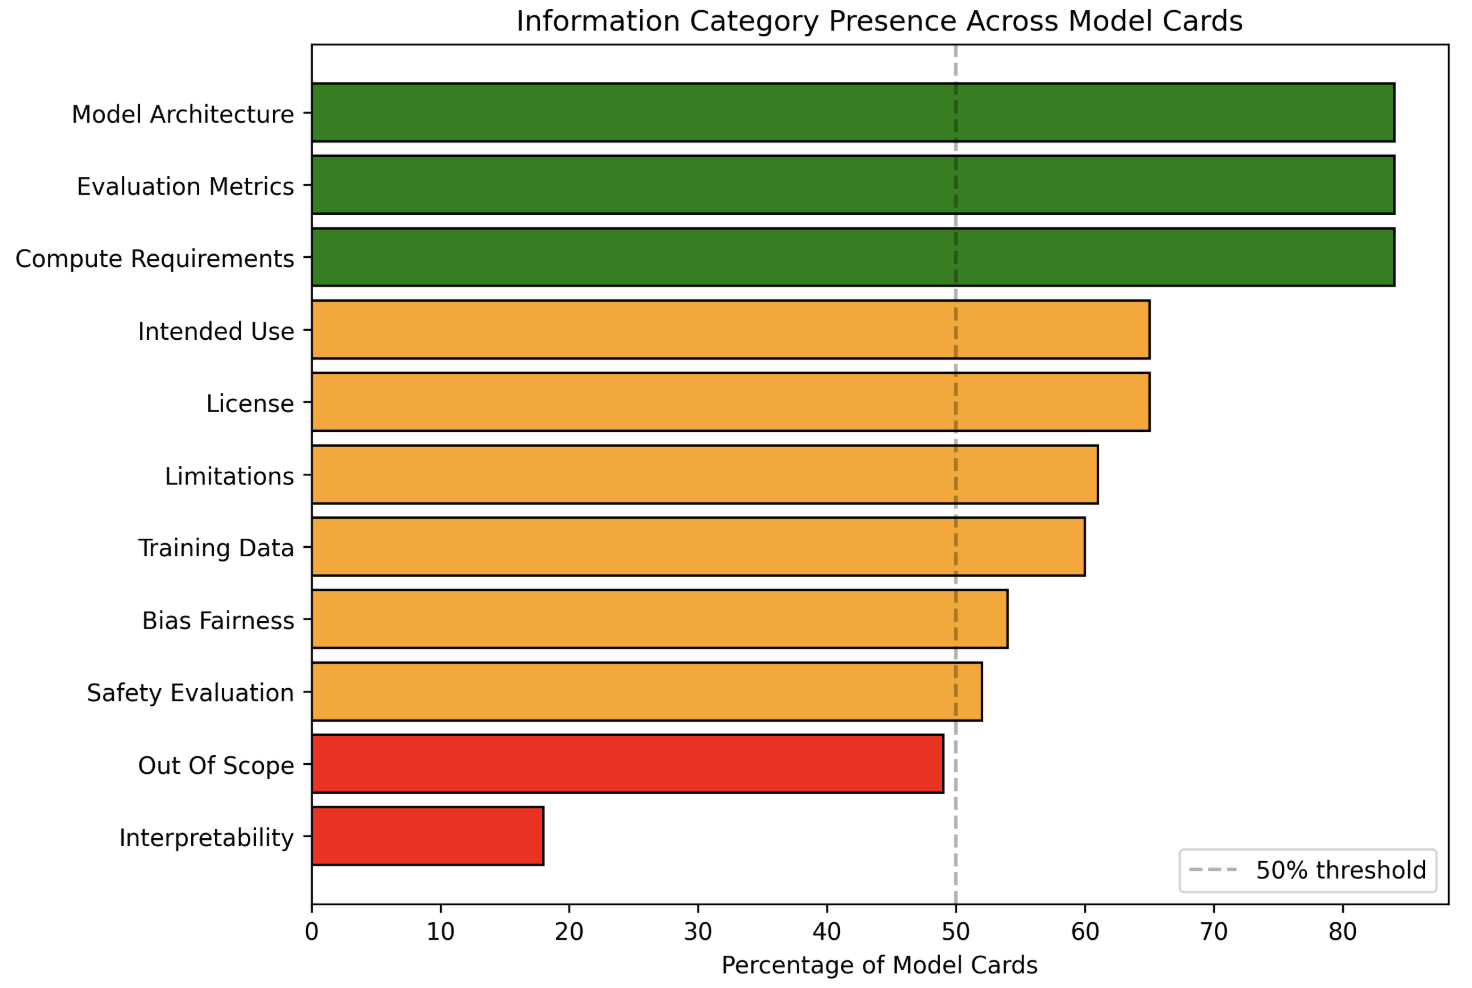
The chart visualizes the presence of 11 information categories across model cards, categorized by their completeness (Present, Partially Present, Not Present). A 50% threshold is marked with a vertical dashed line, indicating a baseline for "adequate" inclusion.
### Components/Axes
- **X-axis**: "Percentage of Model Cards" (0–80%, increments of 10%).
- **Y-axis**: Information categories (listed left-to-right):
1. Model Architecture
2. Evaluation Metrics
3. Compute Requirements
4. Intended Use
5. License
6. Limitations
7. Training Data
8. Bias Fairness
9. Safety Evaluation
10. Out Of Scope
11. Interpretability
- **Legend** (bottom-right):
- Green: "Present"
- Orange: "Partially Present"
- Red: "Not Present"
### Detailed Analysis
1. **Green Bars (Present, 80%)**:
- Model Architecture
- Evaluation Metrics
- Compute Requirements
- All exceed the 50% threshold by 30 percentage points.
2. **Orange Bars (Partially Present, 50–65%)**:
- Intended Use (65%)
- License (65%)
- Limitations (60%)
- Training Data (60%)
- Bias Fairness (55%)
- Safety Evaluation (50%)
- Out Of Scope (50%)
3. **Red Bar (Not Present, 20%)**:
- Interpretability
### Key Observations
- **Dominance of Technical Categories**: 100% of technical categories (Model Architecture, Evaluation Metrics, Compute Requirements) are fully present.
- **Ethical/Governance Categories**: Only 50% of categories like Bias Fairness, Safety Evaluation, and Out Of Scope meet the 50% threshold.
- **Interpretability Gap**: Interpretability is the only category marked "Not Present" (20%), highlighting a critical omission.
### Interpretation
The chart reveals a stark imbalance in model card completeness:
- **Technical Focus**: Core technical details (architecture, evaluation, compute) are consistently prioritized, suggesting a focus on operational transparency.
- **Ethical Oversights**: Categories like Bias Fairness and Safety Evaluation are only partially addressed, indicating potential gaps in addressing societal impacts.
- **Interpretability Crisis**: The absence of Interpretability (20%) is alarming, as it undermines trust and accountability in AI systems. This omission may reflect a lack of tools or prioritization for explainability in model development workflows.
The data underscores a need for standardized frameworks to ensure ethical and interpretability requirements are met alongside technical specifications.