## Line Chart: Best-of-N accuracy with different models
### Overview
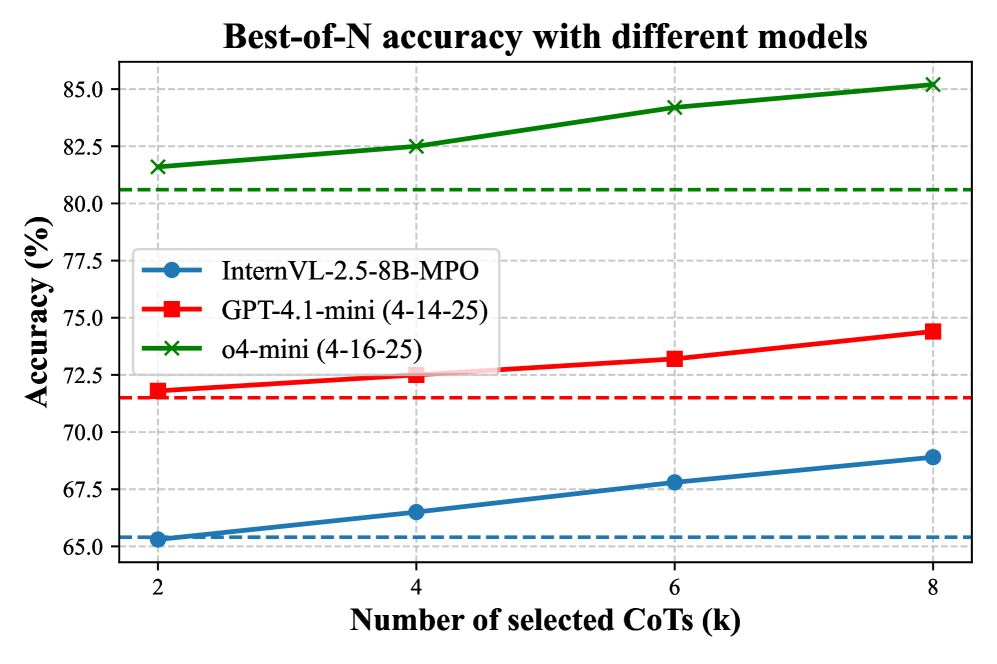
The image is a line chart comparing the "Best-of-N" accuracy of three different models (InternVL-2.5-8B-MPO, GPT-4.1-mini (4-14-25), and o4-mini (4-16-25)) as the number of selected CoTs (Chain of Thoughts) increases from 2 to 8. The chart displays accuracy (%) on the y-axis and the number of selected CoTs (k) on the x-axis.
### Components/Axes
* **Title:** Best-of-N accuracy with different models
* **X-axis:**
* Label: Number of selected CoTs (k)
* Scale: 2, 4, 6, 8
* **Y-axis:**
* Label: Accuracy (%)
* Scale: 65.0, 67.5, 70.0, 72.5, 75.0, 77.5, 80.0, 82.5, 85.0
* **Legend:** Located in the center of the chart.
* Blue line with circle markers: InternVL-2.5-8B-MPO
* Red line with square markers: GPT-4.1-mini (4-14-25)
* Green line with cross markers: o4-mini (4-16-25)
* **Horizontal dashed lines:**
* Blue dashed line at approximately 65.3%
* Red dashed line at approximately 71.5%
* Green dashed line at approximately 80.7%
### Detailed Analysis
* **InternVL-2.5-8B-MPO (Blue):** The line slopes upward.
* At 2 CoTs: Accuracy is approximately 65.3%
* At 4 CoTs: Accuracy is approximately 66.5%
* At 6 CoTs: Accuracy is approximately 67.7%
* At 8 CoTs: Accuracy is approximately 69.0%
* **GPT-4.1-mini (4-14-25) (Red):** The line slopes upward.
* At 2 CoTs: Accuracy is approximately 71.8%
* At 4 CoTs: Accuracy is approximately 72.5%
* At 6 CoTs: Accuracy is approximately 73.3%
* At 8 CoTs: Accuracy is approximately 74.4%
* **o4-mini (4-16-25) (Green):** The line slopes upward.
* At 2 CoTs: Accuracy is approximately 81.7%
* At 4 CoTs: Accuracy is approximately 82.5%
* At 6 CoTs: Accuracy is approximately 84.0%
* At 8 CoTs: Accuracy is approximately 85.3%
### Key Observations
* The o4-mini model consistently outperforms the other two models across all numbers of selected CoTs.
* The InternVL-2.5-8B-MPO model has the lowest accuracy among the three models.
* All three models show an increase in accuracy as the number of selected CoTs increases.
* The dashed lines appear to represent a baseline accuracy for each model, potentially without the use of CoTs.
### Interpretation
The chart illustrates the impact of increasing the number of selected Chain of Thoughts (CoTs) on the accuracy of three different models. The o4-mini model demonstrates the highest accuracy, suggesting it benefits most from the CoT approach or is inherently better at the task being evaluated. The increasing trend in accuracy for all models indicates that using more CoTs generally improves performance, although the extent of improvement varies between models. The horizontal dashed lines may represent the baseline accuracy of each model without CoTs, providing a reference point for evaluating the effectiveness of the CoT strategy.