## Line Chart: Best-of-N Accuracy with Different Models
### Overview
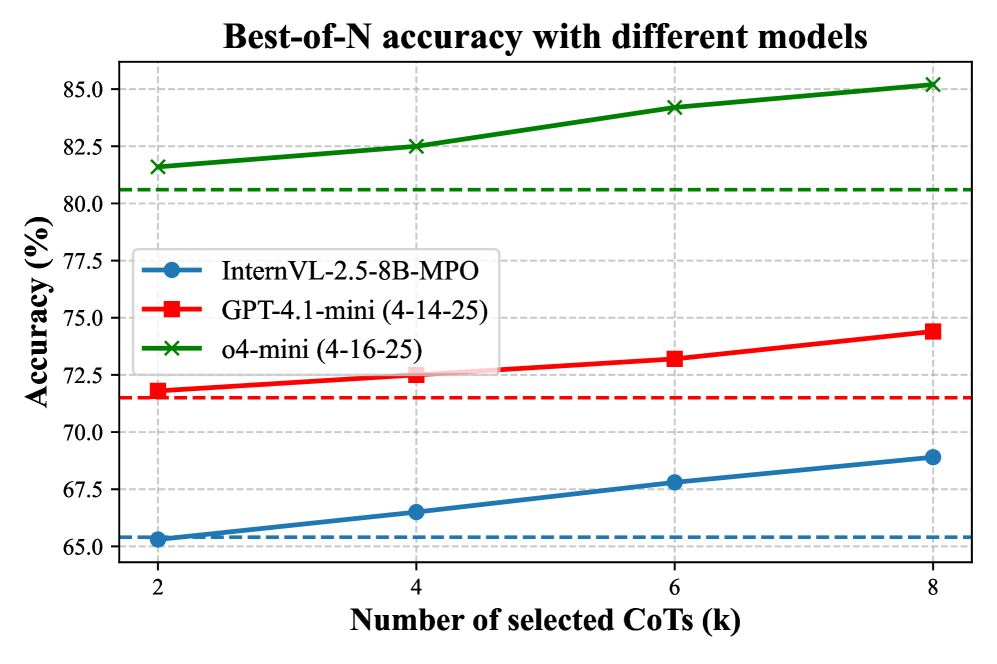
The image is a line chart titled "Best-of-N accuracy with different models." It compares the performance of three distinct AI models as a function of the number of selected Chain-of-Thought (CoT) reasoning paths, denoted as 'k'. The chart demonstrates how accuracy improves for each model as more CoT paths are considered.
### Components/Axes
* **Title:** "Best-of-N accuracy with different models" (centered at the top).
* **Y-Axis:** Labeled "Accuracy (%)". The scale runs from 65.0 to 85.0, with major tick marks every 2.5 units (65.0, 67.5, 70.0, 72.5, 75.0, 77.5, 80.0, 82.5, 85.0).
* **X-Axis:** Labeled "Number of selected CoTs (k)". The scale shows discrete values: 2, 4, 6, and 8.
* **Legend:** Positioned in the top-left quadrant of the plot area. It contains three entries:
1. **InternVL-2.5-8B-MPO:** Represented by a blue line with circular markers.
2. **GPT-4.1-mini (4-14-25):** Represented by a red line with square markers.
3. **o4-mini (4-16-25):** Represented by a green line with 'x' (cross) markers.
* **Baseline Indicators:** Each model has a corresponding horizontal dashed line in its color, indicating a baseline accuracy level (likely the model's performance without CoT selection or with k=1).
### Detailed Analysis
The chart plots three data series, each showing a positive, roughly linear trend where accuracy increases with the number of selected CoTs (k).
**1. InternVL-2.5-8B-MPO (Blue Line, Circle Markers)**
* **Trend:** Slopes gently upward from left to right.
* **Data Points (Approximate):**
* k=2: ~65.2%
* k=4: ~66.5%
* k=6: ~67.8%
* k=8: ~68.9%
* **Baseline (Blue Dashed Line):** Positioned at approximately 65.4%.
**2. GPT-4.1-mini (4-14-25) (Red Line, Square Markers)**
* **Trend:** Slopes upward, with a slightly steeper incline than the blue line.
* **Data Points (Approximate):**
* k=2: ~71.8%
* k=4: ~72.5%
* k=6: ~73.2%
* k=8: ~74.4%
* **Baseline (Red Dashed Line):** Positioned at approximately 71.5%.
**3. o4-mini (4-16-25) (Green Line, Cross Markers)**
* **Trend:** Slopes upward with the steepest incline of the three models.
* **Data Points (Approximate):**
* k=2: ~81.5%
* k=4: ~82.5%
* k=6: ~84.2%
* k=8: ~85.2%
* **Baseline (Green Dashed Line):** Positioned at approximately 80.5%.
### Key Observations
1. **Consistent Hierarchy:** The o4-mini model consistently achieves the highest accuracy across all values of k, followed by GPT-4.1-mini, and then InternVL-2.5-8B-MPO. The performance gaps between models are significant and remain relatively stable.
2. **Positive Scaling:** All three models show a clear benefit from increasing the number of selected CoTs (k). The accuracy gain from k=2 to k=8 is approximately 3.7% for InternVL, 2.6% for GPT-4.1-mini, and 3.7% for o4-mini.
3. **Baseline Comparison:** For each model, the plotted accuracy at k=2 is already above its respective dashed baseline, indicating that even selecting from just two CoT paths provides a measurable improvement over the baseline.
4. **Marginal Diminishing Returns:** While the trend is positive, the rate of improvement appears to slow slightly for each model as k increases (the lines are slightly concave down), suggesting diminishing marginal returns from adding more CoT paths.
### Interpretation
This chart provides empirical evidence for the "Best-of-N" sampling strategy in AI reasoning tasks. The data suggests that:
* **CoT Selection is Effective:** Generating multiple reasoning paths (CoTs) and selecting among them (likely based on a confidence metric or verifier) reliably improves final answer accuracy compared to a single-path baseline for all tested models.
* **Model Capability is Paramount:** While the strategy improves all models, the underlying capability of the base model (o4-mini > GPT-4.1-mini > InternVL) is the primary determinant of absolute performance. The best strategy cannot close the fundamental gap between model generations or architectures.
* **Practical Trade-off:** The positive but sub-linear scaling indicates a trade-off between computational cost (generating and evaluating k paths) and accuracy gain. The optimal 'k' in practice would balance this trade-off, as moving from k=6 to k=8 yields a smaller gain than moving from k=2 to k=4.
* **Consistency of Improvement:** The fact that all models follow the same trend reinforces the generalizability of the Best-of-N technique across different model families and sizes. The specific dates in the model names (4-14-25, 4-16-25) may indicate versioning or release dates, suggesting this is a comparison of contemporaneous models.