## Diagram: Multi-Agent Task Allocation
### Overview
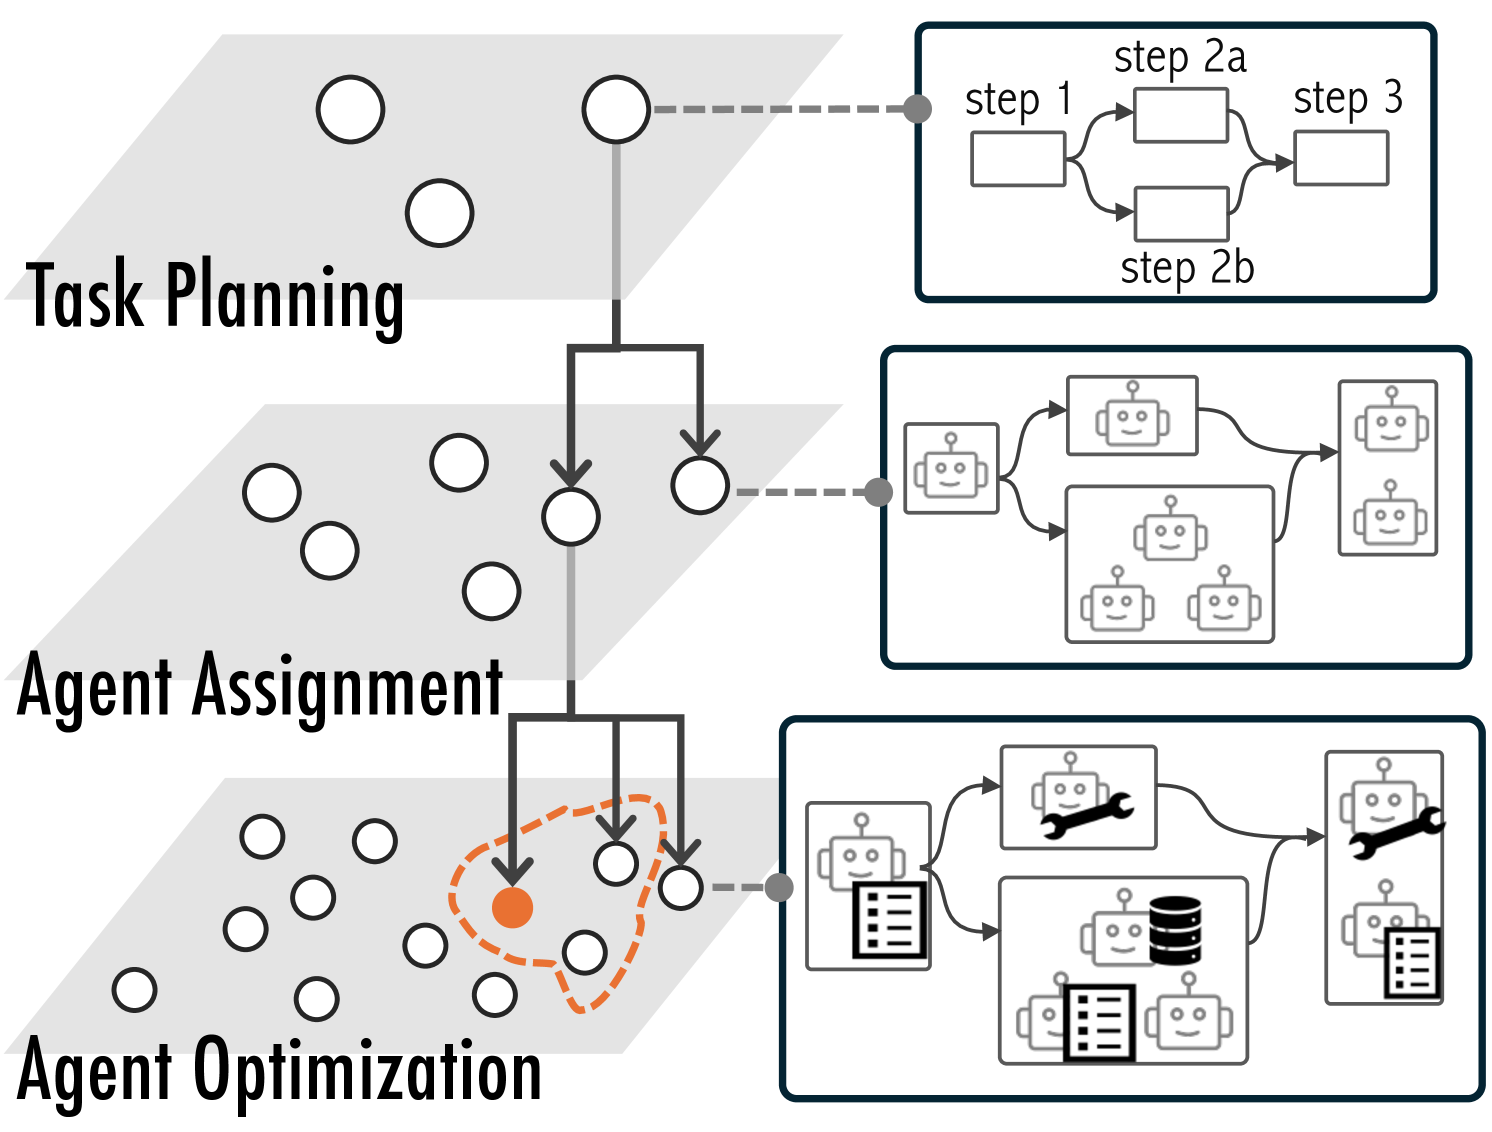
The image is a diagram illustrating a multi-agent task allocation process, broken down into three stages: Task Planning, Agent Assignment, and Agent Optimization. The diagram shows the flow of tasks and agents through these stages, with visual representations of the processes involved.
### Components/Axes
* **Stages (from top to bottom):**
* Task Planning
* Agent Assignment
* Agent Optimization
* **Nodes:** Represent tasks or agents. In the Task Planning and Agent Assignment stages, these are depicted as white circles. In the Agent Optimization stage, one node is highlighted in orange and surrounded by a dashed orange line.
* **Connections:** Represent the flow of tasks/agents between stages. These are shown as solid gray lines with arrows indicating direction. Dashed gray lines connect the stages to detailed process representations on the right.
* **Process Representations (right side):**
* Top: Task Planning process, showing steps 1, 2a, 2b, and 3.
* Middle: Agent Assignment process, showing the assignment of agents (represented by robot icons) to tasks.
* Bottom: Agent Optimization process, showing agents with different capabilities (represented by icons like a wrench and a list) being optimized.
### Detailed Analysis
**Task Planning Stage:**
* Label: "Task Planning" is located on the left side of the diagram.
* Representation: A gray rectangle with white circles inside.
* Flow: A single node at the top splits into two nodes in the Agent Assignment stage.
* Process Details (top-right):
* A box labeled "step 1" leads to two parallel paths labeled "step 2a" and "step 2b". These paths converge into a box labeled "step 3".
**Agent Assignment Stage:**
* Label: "Agent Assignment" is located on the left side of the diagram.
* Representation: A gray rectangle with white circles inside.
* Flow: Two nodes from the Task Planning stage lead to multiple nodes in the Agent Optimization stage.
* Process Details (middle-right):
* Shows the assignment of agents (represented by robot icons) to tasks. The flow starts with a single robot, splits into two groups (one with one robot, the other with three robots), and then merges into a group of two robots.
**Agent Optimization Stage:**
* Label: "Agent Optimization" is located on the left side of the diagram.
* Representation: A gray rectangle with white circles inside. One node is highlighted in orange and surrounded by a dashed orange line.
* Flow: Multiple nodes from the Agent Assignment stage.
* Process Details (bottom-right):
* Shows agents with different capabilities (represented by icons like a wrench and a list) being optimized. The flow starts with a robot with a list icon, splits into two groups (one with a robot with a wrench, the other with three robots and a database icon), and then merges into a group of two robots, one with a wrench and the other with a list icon.
### Key Observations
* The diagram illustrates a sequential process, starting with task planning, moving to agent assignment, and finally to agent optimization.
* The orange node in the Agent Optimization stage likely represents a focus area or a specific agent being optimized.
* The process details on the right provide a more granular view of the activities within each stage.
### Interpretation
The diagram represents a high-level overview of a multi-agent task allocation system. It shows how tasks are planned, how agents are assigned to those tasks, and how the agents' performance or configuration is optimized. The use of visual elements like circles, arrows, and icons helps to convey the flow of information and the relationships between different components of the system. The orange highlight in the Agent Optimization stage suggests that this stage may be the most critical or complex part of the process, requiring focused attention. The diagram suggests a system where tasks are broken down and distributed among multiple agents, and then refined for optimal performance.