## Line Graph: Success Rate vs. δ = n/d
### Overview
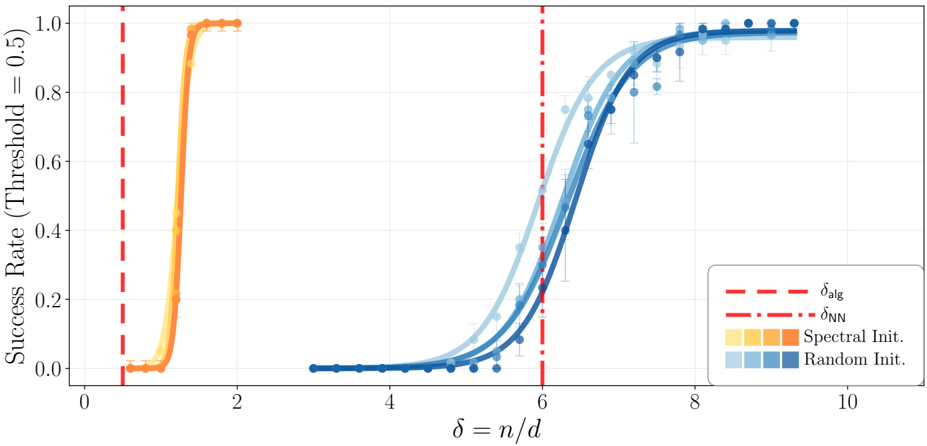
The graph compares the success rate of two initialization methods ("Spectral Init." and "Random Init.") across varying values of δ = n/d. Success rate is measured against a threshold of 0.5, with performance trends visualized through error bars and threshold markers.
### Components/Axes
- **X-axis**: δ = n/d (ranging from 0 to 10, labeled in increments of 2).
- **Y-axis**: Success Rate (Threshold = 0.5), scaled from 0.0 to 1.0 in 0.2 increments.
- **Legend**:
- Red dashed lines: δ_alg (≈1.5) and δ_nn (≈6.5).
- Orange squares: Spectral Init. (solid line with error bars).
- Blue circles: Random Init. (solid line with error bars).
### Detailed Analysis
1. **Spectral Init.** (Orange):
- Starts at δ=0 with a success rate near 0.0.
- Sharp upward transition to 1.0 by δ≈1.5 (marked by red dashed line δ_alg).
- Remains flat at 1.0 for δ > 1.5.
- Error bars are small and consistent, indicating low variability.
2. **Random Init.** (Blue):
- Begins at δ=0 with a success rate near 0.0.
- Gradual increase, surpassing Spectral Init. around δ≈6.5 (marked by red dashed line δ_nn).
- Plateaus near 1.0 by δ=8.
- Error bars grow larger for δ > 6.5, showing increased variability.
### Key Observations
- Spectral Init. achieves near-perfect success rapidly (δ≈1.5) but plateaus early.
- Random Init. lags initially but outperforms Spectral Init. for δ > 6.5.
- Thresholds δ_alg and δ_nn demarcate critical performance shifts for each method.
- Error bars suggest Spectral Init. is more reliable at low δ, while Random Init. becomes less consistent at higher δ.
### Interpretation
The graph demonstrates a trade-off between initialization methods:
- **Spectral Init.** excels in low-δ regimes (δ < 6.5), likely due to structured initialization aligning with problem constraints.
- **Random Init.** becomes competitive at higher δ (δ > 6.5), possibly due to stochastic exploration overcoming initialization biases.
- The thresholds δ_alg and δ_nn may represent problem-specific breakpoints where algorithmic efficiency or data distribution characteristics shift.
- Variability in Random Init. at high δ suggests sensitivity to hyperparameters or noise, whereas Spectral Init.'s consistency implies robustness in controlled settings.