TECHNICAL ASSET FINGERPRINT
77037586ab097ce8e7bd4b36
Click to view fullscreen
Press ESC or click to close
FOUND IN PAPERS
EXPERT: healer-alpha-free VERSION 1
RUNTIME: free/openrouter/healer-alpha
INTEL_VERIFIED
## Density Plots: Token Count Distributions by Query Type and Dataset
### Overview
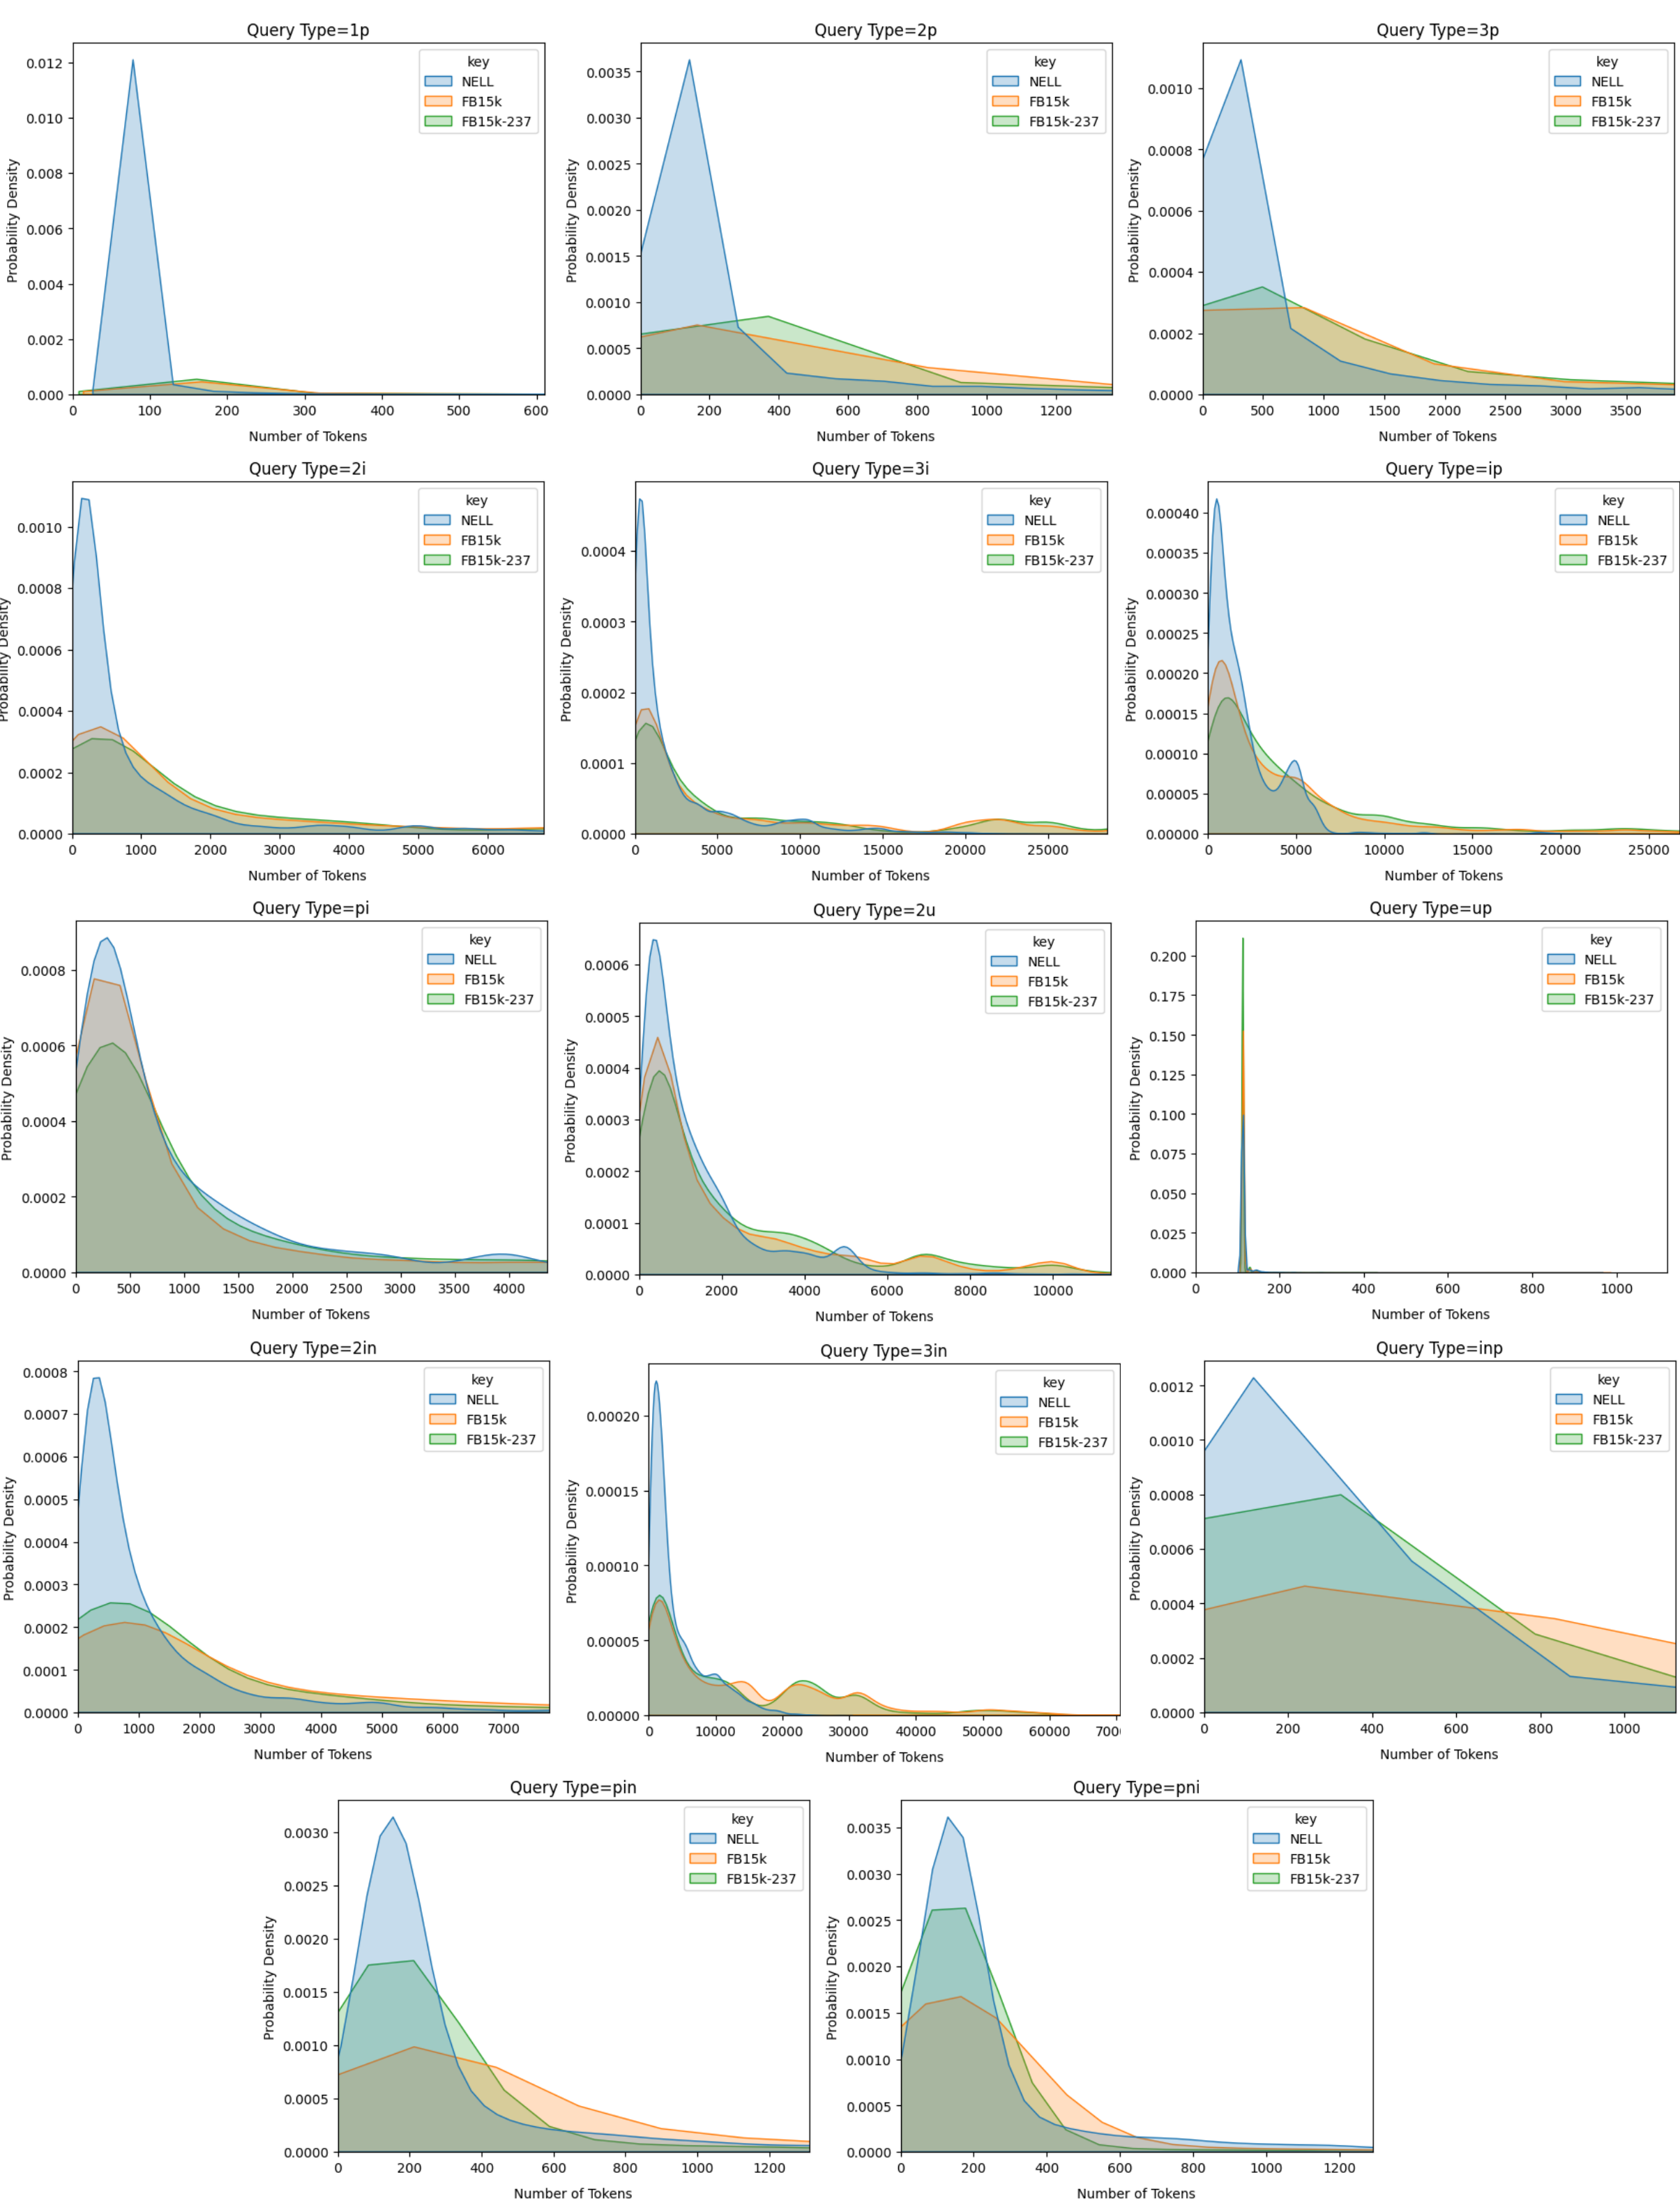
The image displays a 5x3 grid of 14 individual density plots (the bottom-right cell is empty). Each plot visualizes the probability density distribution of the "Number of Tokens" for a specific query type across three different knowledge graph datasets: NELL, FB15k, and FB15k-237. The overall purpose is to compare the token length characteristics of different query structures across these datasets.
### Components/Axes
* **Grid Structure:** 14 subplots arranged in rows and columns.
* **Subplot Titles:** Each subplot is titled with a specific "Query Type" (e.g., `Query Type=1p`, `Query Type=2p`, `Query Type=3p`, `Query Type=2i`, `Query Type=3i`, `Query Type=ip`, `Query Type=pi`, `Query Type=2u`, `Query Type=up`, `Query Type=2in`, `Query Type=3in`, `Query Type=inp`, `Query Type=pin`, `Query Type=pni`).
* **X-Axis:** Labeled "Number of Tokens" for all plots. The scale varies significantly between plots, ranging from a maximum of ~600 (for `1p`) to ~70,000 (for `3in`).
* **Y-Axis:** Labeled "Probability Density" for all plots. The scale also varies, with peak densities ranging from ~0.0002 to ~0.20.
* **Legend:** Present in the top-right corner of each subplot. It contains three entries:
* `NELL` (represented by a blue filled area/line)
* `FB15k` (represented by an orange filled area/line)
* `FB15k-237` (represented by a green filled area/line)
### Detailed Analysis
The following describes each subplot, noting the approximate x-axis range, the visual trend for each dataset, and key density peaks.
**Row 1:**
1. **Query Type=1p:** X-axis: 0-600. **NELL (blue):** Extremely sharp, high peak (density ~0.012) near 100 tokens, then drops to near zero. **FB15k (orange) & FB15k-237 (green):** Very low, broad distributions peaking gently around 150-200 tokens.
2. **Query Type=2p:** X-axis: 0-1200. **NELL:** Sharp peak (density ~0.0035) near 150 tokens. **FB15k & FB15k-237:** Broader, lower distributions. FB15k-237 (green) has a slightly higher and later peak (~400 tokens) than FB15k.
3. **Query Type=3p:** X-axis: 0-3500. **NELL:** Sharp peak (density ~0.0010) near 250 tokens. **FB15k & FB15k-237:** Very broad, low distributions extending past 3000 tokens, with FB15k-237 peaking slightly higher and earlier than FB15k.
**Row 2:**
4. **Query Type=2i:** X-axis: 0-6000. **NELL:** Sharp peak (density ~0.0010) near 200 tokens. **FB15k & FB15k-237:** Broad distributions with peaks around 500-1000 tokens, extending to 6000.
5. **Query Type=3i:** X-axis: 0-25000. **NELL:** Sharp peak (density ~0.0004) near 500 tokens. **FB15k & FB15k-237:** Very broad, low distributions with multiple small humps, extending to 25,000 tokens.
6. **Query Type=ip:** X-axis: 0-25000. **NELL:** Sharp peak (density ~0.0004) near 1000 tokens. **FB15k & FB15k-237:** Broad distributions with a notable secondary hump for FB15k around 5000 tokens.
**Row 3:**
7. **Query Type=pi:** X-axis: 0-4000. **NELL:** Sharp peak (density ~0.0008) near 250 tokens. **FB15k & FB15k-237:** Broader distributions with peaks around 500 tokens, extending to 4000.
8. **Query Type=2u:** X-axis: 0-10000. **NELL:** Sharp peak (density ~0.0006) near 500 tokens. **FB15k & FB15k-237:** Broad distributions with peaks around 1000-2000 tokens.
9. **Query Type=up:** X-axis: 0-1000. **NELL:** Extremely sharp, very high peak (density ~0.20) near 100 tokens. **FB15k & FB15k-237:** Very low, flat distributions barely visible on this scale.
**Row 4:**
10. **Query Type=2in:** X-axis: 0-7000. **NELL:** Sharp peak (density ~0.0008) near 500 tokens. **FB15k & FB15k-237:** Broader distributions with peaks around 1000-1500 tokens.
11. **Query Type=3in:** X-axis: 0-70000. **NELL:** Sharp peak (density ~0.0002) near 2000 tokens. **FB15k & FB15k-237:** Very broad, low distributions with multiple small humps, extending to 70,000 tokens.
12. **Query Type=inp:** X-axis: 0-1000. **NELL:** Broad peak (density ~0.0012) centered around 200 tokens. **FB15k & FB15k-237:** Broader, lower distributions. FB15k-237 (green) is notably higher than FB15k (orange) across most of the range.
**Row 5:**
13. **Query Type=pin:** X-axis: 0-1200. **NELL:** Sharp peak (density ~0.0030) near 200 tokens. **FB15k & FB15k-237:** Broader distributions with peaks around 300-400 tokens.
14. **Query Type=pni:** X-axis: 0-1200. **NELL:** Sharp peak (density ~0.0035) near 150 tokens. **FB15k & FB15k-237:** Broader distributions with peaks around 200-300 tokens.
### Key Observations
1. **Consistent Dataset Behavior:** Across nearly all query types, the **NELL** dataset (blue) exhibits a distribution with a much sharper, higher peak at a lower token count compared to the other two datasets. This indicates NELL queries are consistently more concise.
2. **FB15k vs. FB15k-237:** The **FB15k** (orange) and **FB15k-237** (green) distributions are generally broader and shifted to higher token counts. In many plots (e.g., `2p`, `3p`, `inp`), the FB15k-237 distribution is slightly higher or peaks earlier than the standard FB15k distribution.
3. **Query Type Complexity:** The x-axis scale (max token count) increases with apparent query complexity. Simple queries like `1p` and `up` have ranges <1000, while complex queries like `3i`, `3in`, and `ip` have ranges extending to 25,000-70,000 tokens.
4. **Extreme Outlier:** The `Query Type=up` plot is a major outlier. The NELL distribution here is an exceptionally sharp spike (density ~0.20), suggesting this specific query type in NELL has an extremely consistent and very short token length. The FB15k distributions are negligible on this scale.
### Interpretation
This visualization provides a technical analysis of query structure complexity across different knowledge graph benchmarks. The data suggests:
* **Structural Differences in Datasets:** The stark contrast between NELL and the FB15k variants implies fundamental differences in how queries are formulated or what they represent in these datasets. NELL queries appear to be templated or constrained to be very short, while FB15k queries allow for much greater variability and length.
* **Impact of Dataset Version:** The subtle but consistent differences between FB15k and FB15k-237 (a filtered version of FB15k) suggest that the filtering process may slightly alter the distribution of query lengths, often making them marginally shorter or more concentrated.
* **Query Type Taxonomy:** The varying x-axis scales serve as a proxy for the inherent complexity of the query types. The `u` (union) and `n` (negation) operators, especially in combination (`3in`), appear to generate the most verbose queries. The `p` (projection) and `i` (intersection) operators also lead to longer queries.
* **Practical Implication:** For researchers using these datasets, this analysis highlights that models processing FB15k queries must handle significantly longer and more variable input sequences than those processing NELL. The `up` query type in NELL is a special case of extreme consistency. This information is crucial for designing model architectures, setting maximum sequence lengths, and understanding benchmark difficulty.
DECODING INTELLIGENCE...