## Line Graphs: Probability Density Distributions Across Query Types and Models
### Overview
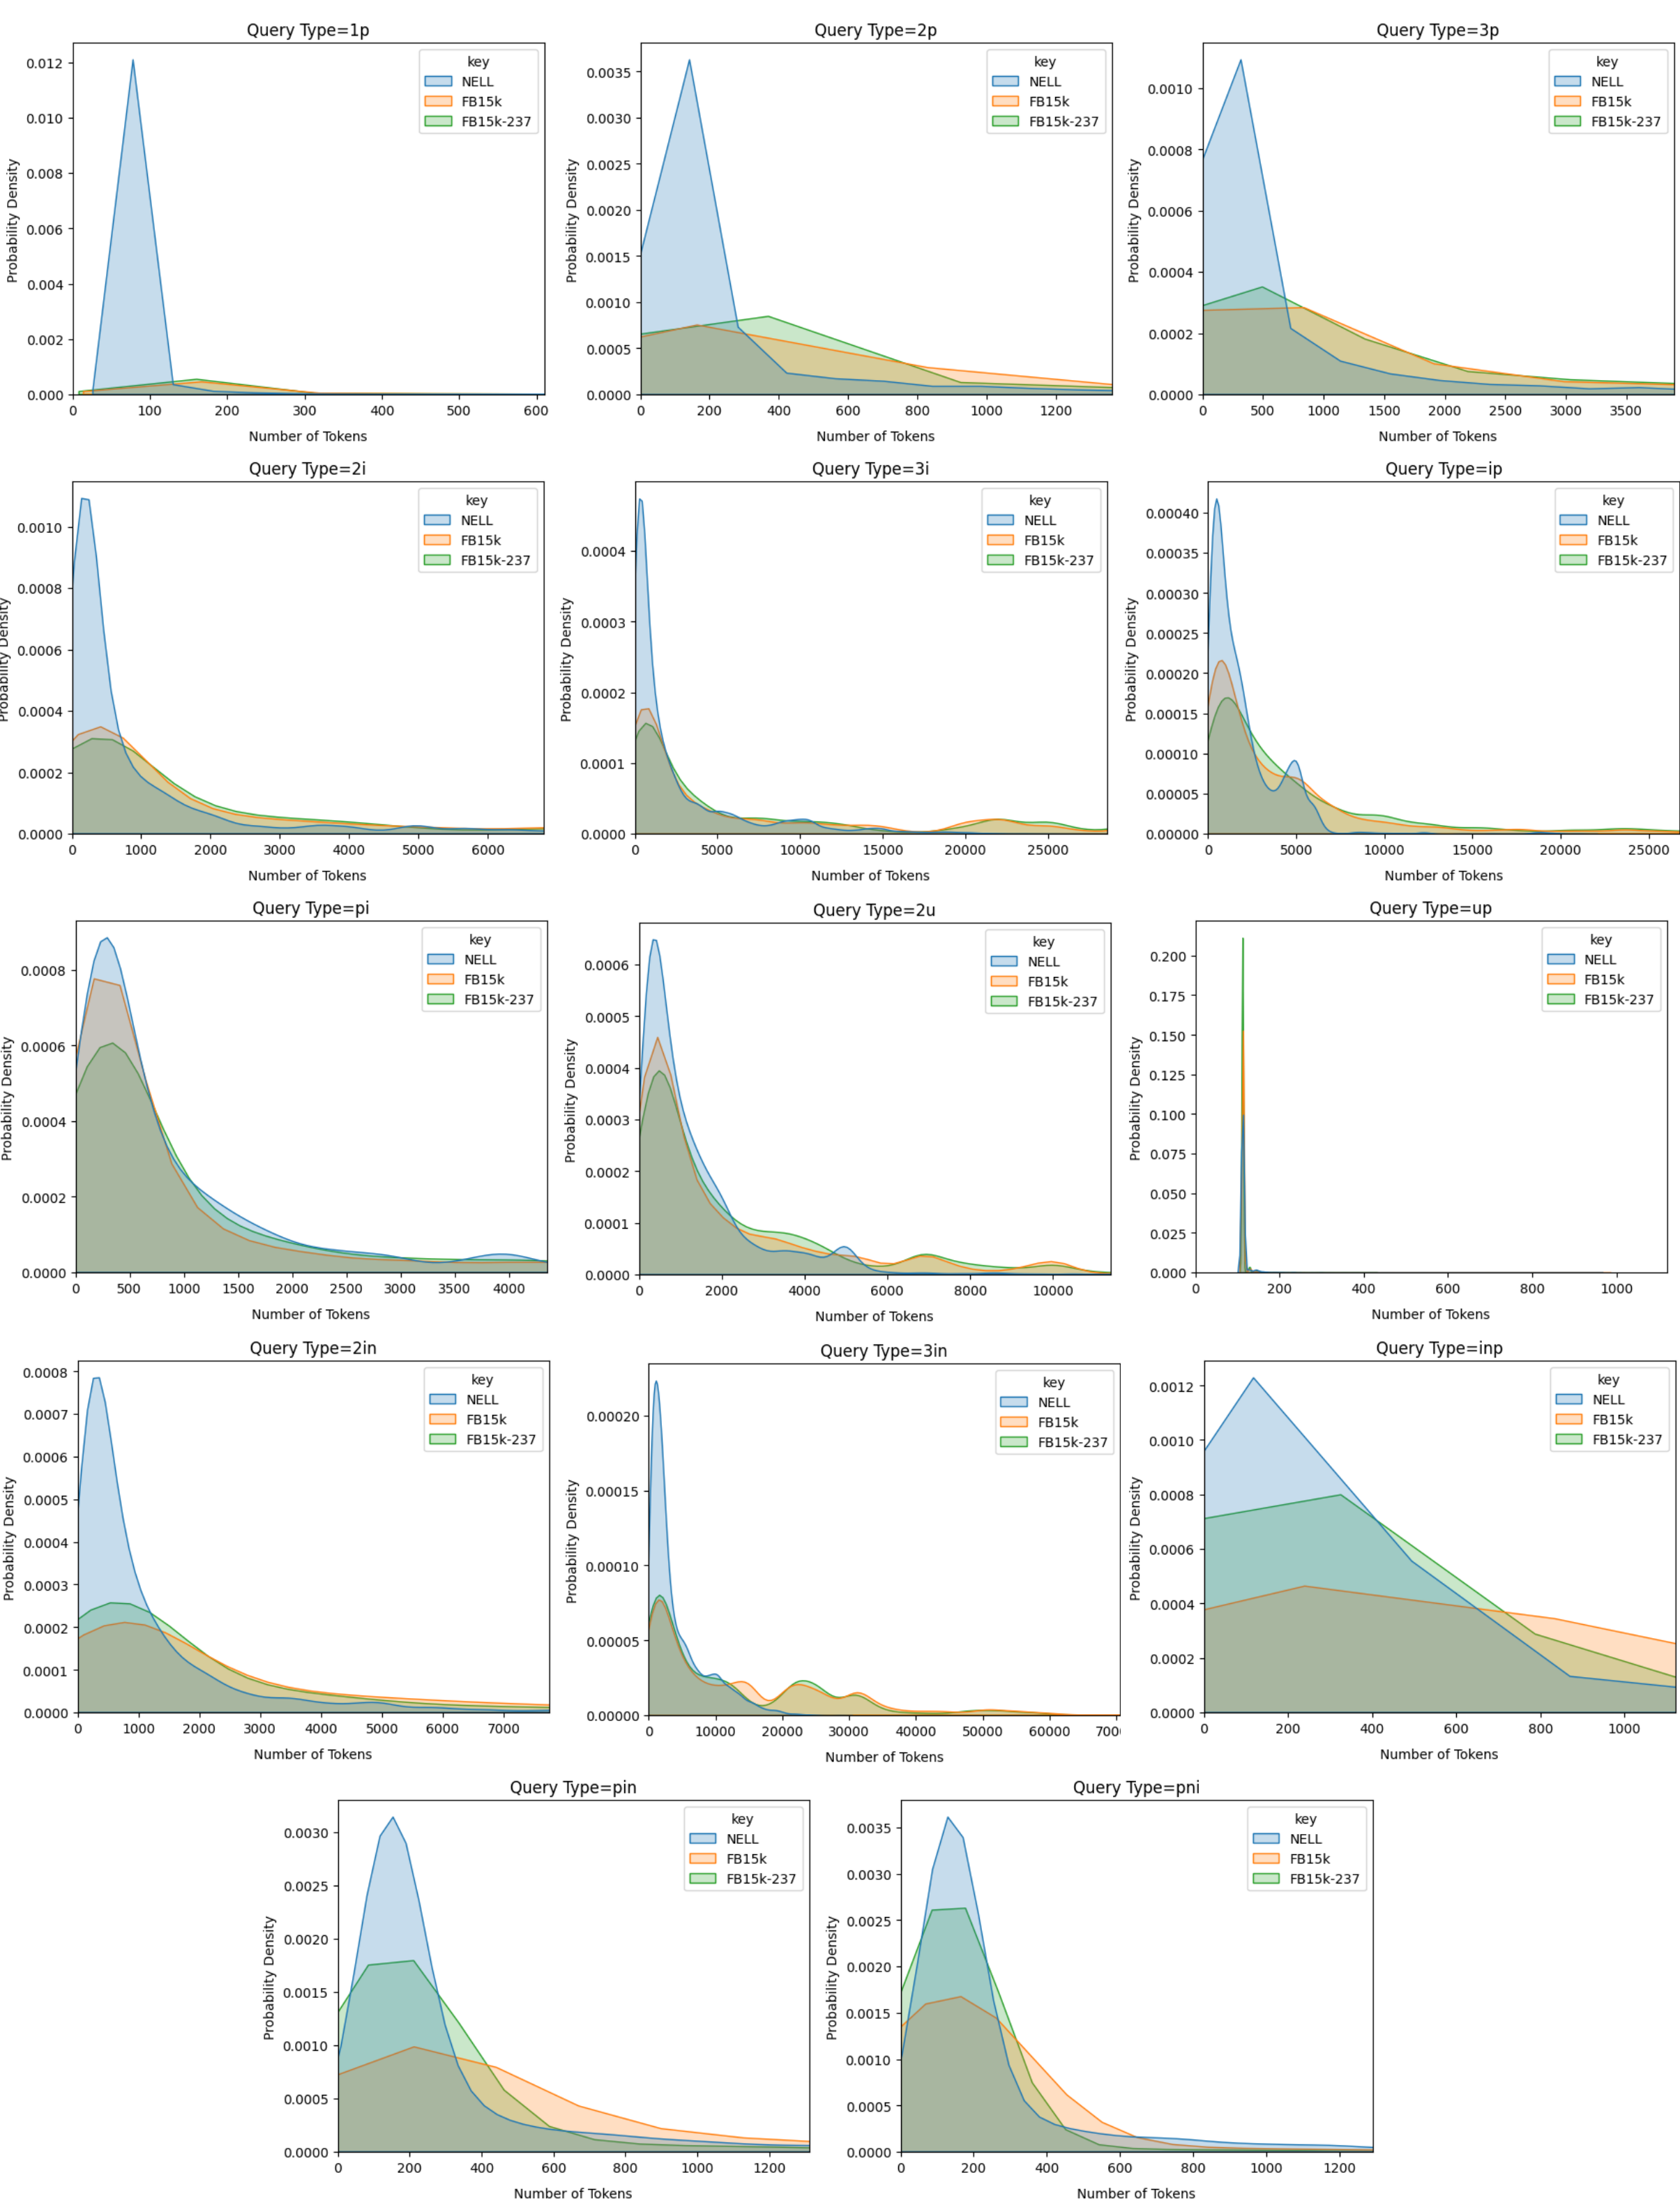
The image displays 14 line graphs arranged in a grid, each representing the probability density distribution of token counts for different query types (e.g., `1p`, `2p`, `3p`, `ip`, `pi`, `up`, `in`, `inp`, `pin`, `2i`, `3i`, `2u`, `3u`). Three models are compared: `key` (blue), `NELL` (orange), and `FB15k-237` (green). Each graph shows how token counts are probabilistically distributed for a specific query type across these models.
---
### Components/Axes
- **X-Axis**: "Number of Tokens" (ranges vary per graph, e.g., 0–600 for `1p`, 0–1200 for `2p`, up to 10,000 for `2u`).
- **Y-Axis**: "Probability Density" (consistent scale: 0.0000 to 0.0012).
- **Legend**: Located in the top-right corner of each graph, with labels:
- `key` (blue)
- `NELL` (orange)
- `FB15k-237` (green)
- **Graph Titles**: Positioned at the top of each subplot, labeled with query types (e.g., `Query Type=1p`, `Query Type=2p`).
---
### Detailed Analysis
#### Query Type `1p`
- **Key (blue)**: Sharp peak at ~100 tokens (probability density ~0.0012).
- **NELL (orange)**: Broader distribution, peaking at ~150 tokens (density ~0.0008).
- **FB15k-237 (green)**: Flattest distribution, peaking at ~200 tokens (density ~0.0005).
#### Query Type `2p`
- **Key (blue)**: Peak at ~200 tokens (density ~0.0035).
- **NELL (orange)**: Broader peak at ~300 tokens (density ~0.0025).
- **FB15k-237 (green)**: Gradual decline from ~400 tokens (density ~0.0015).
#### Query Type `3p`
- **Key (blue)**: Peak at ~500 tokens (density ~0.0010).
- **NELL (orange)**: Broader peak at ~700 tokens (density ~0.0008).
- **FB15k-237 (green)**: Flattest distribution, peaking at ~1,000 tokens (density ~0.0005).
#### Query Type `ip`
- **Key (blue)**: Sharp peak at ~200 tokens (density ~0.0004).
- **NELL (orange)**: Broader peak at ~300 tokens (density ~0.0002).
- **FB15k-237 (green)**: Flattest distribution, peaking at ~500 tokens (density ~0.0001).
#### Query Type `pi`
- **Key (blue)**: Sharp peak at ~1,000 tokens (density ~0.0008).
- **NELL (orange)**: Broader peak at ~1,500 tokens (density ~0.0005).
- **FB15k-237 (green)**: Flattest distribution, peaking at ~2,000 tokens (density ~0.0003).
#### Query Type `up`
- **Key (blue)**: Single sharp peak at ~200 tokens (density ~0.20).
- **NELL (orange)**: Minimal presence, negligible density.
- **FB15k-237 (green)**: Minimal presence, negligible density.
#### Query Type `in`
- **Key (blue)**: Sharp peak at ~1,000 tokens (density ~0.0020).
- **NELL (orange)**: Broader peak at ~2,000 tokens (density ~0.0010).
- **FB15k-237 (green)**: Flattest distribution, peaking at ~3,000 tokens (density ~0.0005).
#### Query Type `inp`
- **Key (blue)**: Sharp peak at ~500 tokens (density ~0.0012).
- **NELL (orange)**: Broader peak at ~800 tokens (density ~0.0008).
- **FB15k-237 (green)**: Flattest distribution, peaking at ~1,200 tokens (density ~0.0005).
#### Query Type `pin`
- **Key (blue)**: Sharp peak at ~300 tokens (density ~0.0030).
- **NELL (orange)**: Broader peak at ~500 tokens (density ~0.0020).
- **FB15k-237 (green)**: Flattest distribution, peaking at ~700 tokens (density ~0.0010).
#### Query Type `pi` (Repeated)
- Same as earlier `pi` analysis.
#### Query Type `2i`
- **Key (blue)**: Sharp peak at ~1,000 tokens (density ~0.0008).
- **NELL (orange)**: Broader peak at ~2,000 tokens (density ~0.0005).
- **FB15k-237 (green)**: Flattest distribution, peaking at ~3,000 tokens (density ~0.0003).
#### Query Type `3i`
- **Key (blue)**: Sharp peak at ~5,000 tokens (density ~0.0004).
- **NELL (orange)**: Broader peak at ~7,000 tokens (density ~0.0003).
- **FB15k-237 (green)**: Flattest distribution, peaking at ~9,000 tokens (density ~0.0002).
#### Query Type `2u`
- **Key (blue)**: Sharp peak at ~5,000 tokens (density ~0.0006).
- **NELL (orange)**: Broader peak at ~7,000 tokens (density ~0.0004).
- **FB15k-237 (green)**: Flattest distribution, peaking at ~9,000 tokens (density ~0.0002).
#### Query Type `3u`
- **Key (blue)**: Sharp peak at ~10,000 tokens (density ~0.0003).
- **NELL (orange)**: Broader peak at ~12,000 tokens (density ~0.0002).
- **FB15k-237 (green)**: Flattest distribution, peaking at ~14,000 tokens (density ~0.0001).
---
### Key Observations
1. **Model Differences**:
- `key` consistently shows sharp, narrow peaks, indicating precise token usage.
- `NELL` exhibits broader distributions, suggesting variability in token requirements.
- `FB15k-237` has the flattest distributions, implying uniform token usage across ranges.
2. **Query Type Trends**:
- Complex query types (e.g., `3p`, `2u`, `3u`) require higher token counts.
- Simpler query types (e.g., `1p`, `up`) cluster around lower token counts.
3. **Anomalies**:
- The `up` query type (`Query Type=up`) has an extreme outlier: `key` dominates with a single sharp peak, while `NELL` and `FB15k-237` are negligible.
---
### Interpretation
The data suggests that:
- The `key` model is optimized for specific token counts, likely due to its precision in handling structured queries.
- `NELL` and `FB15k-237` models exhibit trade-offs between flexibility and uniformity, with `NELL` being more variable and `FB15k-237` more consistent.
- Query types with higher token counts (e.g., `3p`, `2u`) may involve more complex or ambiguous tasks, requiring models to explore wider token ranges.
- The `up` query type’s dominance by `key` highlights its unique suitability for this specific task, possibly due to its simplicity or structured nature.
This analysis underscores the importance of model selection based on query complexity and token efficiency requirements.