## Bar Chart: Used Weights per Layer
### Overview
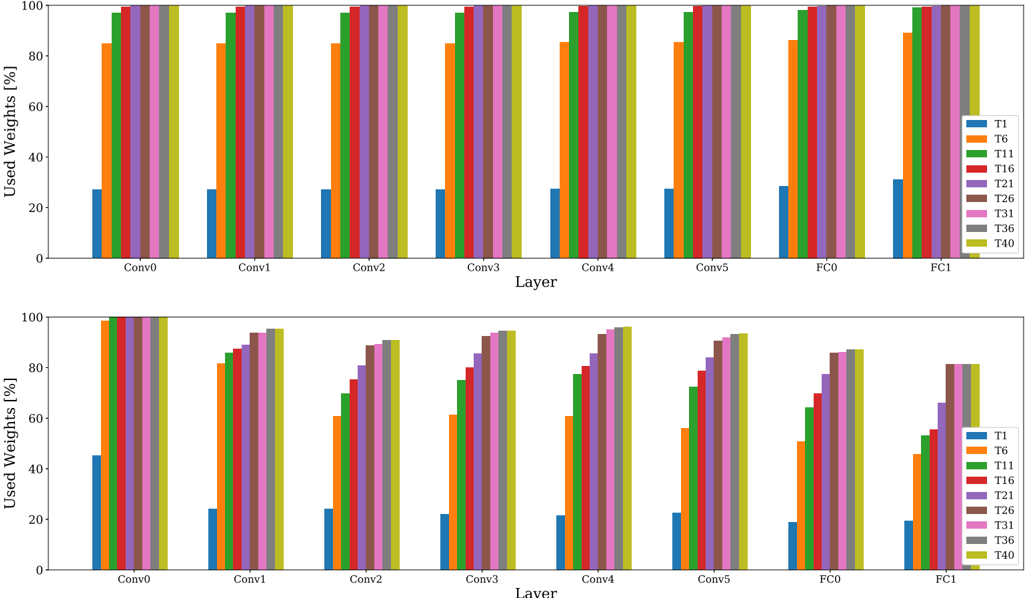
The image contains two bar charts, one above the other, displaying the percentage of used weights for different layers in a neural network. The x-axis represents the layer type (Conv0 to Conv5, FC0, FC1), and the y-axis represents the percentage of used weights, ranging from 0% to 100%. Each layer has multiple bars representing different training iterations (T1, T6, T11, T16, T21, T26, T31, T36, T40). The two charts appear to represent different scenarios or configurations, as the weight usage varies between them.
### Components/Axes
* **Title:** "Used Weights [%]" (Y-axis label, repeated for both charts)
* **X-axis:** "Layer" (Label for both charts)
* **Y-axis:** Percentage of used weights, ranging from 0% to 100% with tick marks at 0, 20, 40, 60, 80, and 100.
* **X-axis Labels:** Conv0, Conv1, Conv2, Conv3, Conv4, Conv5, FC0, FC1 (Identical for both charts)
* **Legend:** Located on the right side of the charts.
* T1 (Blue)
* T6 (Orange)
* T11 (Green)
* T16 (Red)
* T21 (Purple)
* T26 (Brown)
* T31 (Pink)
* T36 (Gray)
* T40 (Yellow/Olive)
### Detailed Analysis
**Top Chart:**
* **General Trend:** For most layers (Conv0 to Conv5), the used weights are close to 100% for all training iterations (T6 to T40). T1 (blue) consistently shows a significantly lower percentage of used weights compared to the other iterations. FC0 and FC1 also show high usage across all training iterations except T1.
* **Conv0 to Conv5:**
* T1: Approximately 25% used weights.
* T6 to T40: Approximately 95-100% used weights.
* **FC0:**
* T1: Approximately 25% used weights.
* T6 to T40: Approximately 95-100% used weights.
* **FC1:**
* T1: Approximately 25% used weights.
* T6 to T40: Approximately 95-100% used weights.
**Bottom Chart:**
* **General Trend:** The used weights generally increase from Conv0 to Conv5, and then decrease for FC0 and FC1. The difference in used weights between different training iterations (T1 to T40) is more pronounced compared to the top chart.
* **Conv0:**
* T1: Approximately 45% used weights.
* T6 to T40: Approximately 95-100% used weights.
* **Conv1:**
* T1: Approximately 25% used weights.
* T6: Approximately 80% used weights.
* T11: Approximately 85% used weights.
* T16: Approximately 88% used weights.
* T21: Approximately 90% used weights.
* T26 to T40: Approximately 95-100% used weights.
* **Conv2:**
* T1: Approximately 25% used weights.
* T6: Approximately 60% used weights.
* T11: Approximately 70% used weights.
* T16: Approximately 75% used weights.
* T21: Approximately 80% used weights.
* T26 to T40: Approximately 90-95% used weights.
* **Conv3:**
* T1: Approximately 25% used weights.
* T6: Approximately 70% used weights.
* T11: Approximately 80% used weights.
* T16: Approximately 85% used weights.
* T21: Approximately 90% used weights.
* T26 to T40: Approximately 95-100% used weights.
* **Conv4:**
* T1: Approximately 25% used weights.
* T6: Approximately 75% used weights.
* T11: Approximately 85% used weights.
* T16: Approximately 90% used weights.
* T21 to T40: Approximately 95-100% used weights.
* **Conv5:**
* T1: Approximately 25% used weights.
* T6: Approximately 85% used weights.
* T11 to T40: Approximately 95-100% used weights.
* **FC0:**
* T1: Approximately 25% used weights.
* T6: Approximately 60% used weights.
* T11: Approximately 70% used weights.
* T16: Approximately 75% used weights.
* T21 to T40: Approximately 85-90% used weights.
* **FC1:**
* T1: Approximately 25% used weights.
* T6: Approximately 55% used weights.
* T11: Approximately 65% used weights.
* T16: Approximately 70% used weights.
* T21 to T40: Approximately 80-85% used weights.
### Key Observations
* In both charts, the initial training iteration (T1) consistently uses significantly fewer weights compared to later iterations (T6 to T40).
* The top chart shows a more consistent and high usage of weights across all layers and training iterations (except T1), suggesting a more stable or optimized configuration.
* The bottom chart shows a more gradual increase in weight usage as training progresses, particularly in the convolutional layers (Conv1 to Conv5), indicating a learning process where more weights are activated over time.
* The fully connected layers (FC0 and FC1) in the bottom chart show a decrease in weight usage compared to the convolutional layers, suggesting that these layers might be less critical or require fewer parameters for the specific task.
### Interpretation
The charts illustrate the weight usage patterns in a neural network during different stages of training. The top chart likely represents a scenario where the network is already well-initialized or pre-trained, leading to high weight usage from the early training iterations. The bottom chart, on the other hand, likely represents a scenario where the network is trained from scratch or with a less optimal initialization, resulting in a gradual increase in weight usage as the network learns.
The significant difference in weight usage for T1 in both charts suggests that the initial training iteration might be crucial for activating the relevant weights and establishing a good starting point for subsequent training. The gradual increase in weight usage in the bottom chart highlights the importance of training iterations in refining the network's parameters and activating more weights to improve performance.
The decrease in weight usage for FC0 and FC1 in the bottom chart could indicate that these layers are either over-parameterized or less relevant for the specific task, suggesting potential for optimization by reducing the number of neurons or applying regularization techniques.