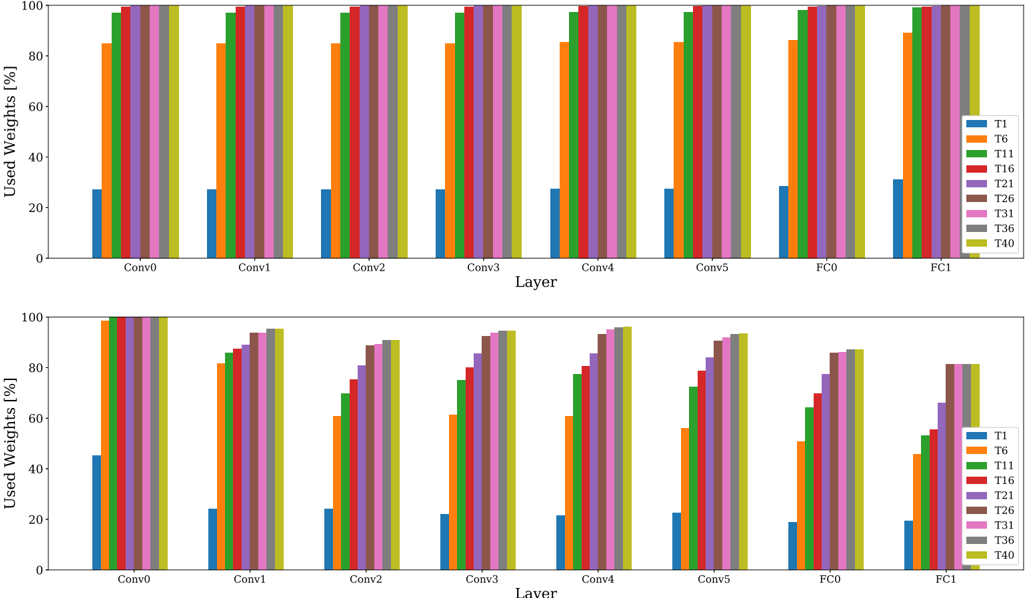
## Bar Chart: Used Weights Percentage per Layer and Task
### Overview
The image presents two bar charts displaying the percentage of used weights for different layers (Conv0, Conv1, Conv2, Conv3, Conv4, Conv5, FC0, FC1) across multiple tasks (T1, T6, T11, T16, T21, T26, T31, T36, T40). The y-axis represents the percentage of used weights, ranging from 0% to 100%. The x-axis represents the layer names. Each task is represented by a different color. The two charts appear to be identical.
### Components/Axes
* **X-axis:** Layer - labeled with "Layer". The layers are: Conv0, Conv1, Conv2, Conv3, Conv4, Conv5, FC0, FC1.
* **Y-axis:** Used Weights [%] - labeled with "Used Weights [%]". The scale ranges from 0 to 100.
* **Legend:** Located on the right side of each chart. The legend identifies each task with a corresponding color:
* T1 - Blue
* T6 - Green
* T11 - Yellow
* T16 - Magenta
* T21 - Cyan
* T26 - Red
* T31 - Purple
* T36 - Orange
* T40 - Teal
### Detailed Analysis or Content Details
**Chart 1 (Top)**
* **Conv0:**
* T1: ~8%
* T6: ~96%
* T11: ~96%
* T16: ~96%
* T21: ~96%
* T26: ~28%
* T31: ~96%
* T36: ~96%
* T40: ~96%
* **Conv1:**
* T1: ~8%
* T6: ~96%
* T11: ~96%
* T16: ~96%
* T21: ~96%
* T26: ~28%
* T31: ~96%
* T36: ~96%
* T40: ~96%
* **Conv2:**
* T1: ~8%
* T6: ~96%
* T11: ~96%
* T16: ~96%
* T21: ~96%
* T26: ~28%
* T31: ~96%
* T36: ~96%
* T40: ~96%
* **Conv3:**
* T1: ~8%
* T6: ~96%
* T11: ~96%
* T16: ~96%
* T21: ~96%
* T26: ~28%
* T31: ~96%
* T36: ~96%
* T40: ~96%
* **Conv4:**
* T1: ~8%
* T6: ~96%
* T11: ~96%
* T16: ~96%
* T21: ~96%
* T26: ~28%
* T31: ~96%
* T36: ~96%
* T40: ~96%
* **Conv5:**
* T1: ~24%
* T6: ~96%
* T11: ~96%
* T16: ~96%
* T21: ~96%
* T26: ~28%
* T31: ~96%
* T36: ~96%
* T40: ~96%
* **FC0:**
* T1: ~88%
* T6: ~96%
* T11: ~96%
* T16: ~96%
* T21: ~96%
* T26: ~28%
* T31: ~96%
* T36: ~96%
* T40: ~96%
* **FC1:**
* T1: ~88%
* T6: ~96%
* T11: ~96%
* T16: ~96%
* T21: ~96%
* T26: ~28%
* T31: ~96%
* T36: ~96%
* T40: ~96%
**Chart 2 (Bottom)**
The data in Chart 2 is identical to Chart 1.
### Key Observations
* Tasks T6, T11, T16, T21, T31, T36, and T40 consistently exhibit high used weight percentages (close to 100%) across all layers.
* Task T1 shows significantly lower used weight percentages (around 8-24%) for all layers except FC0 and FC1, where it reaches approximately 88%.
* Task T26 consistently shows a used weight percentage of around 28% across all layers except FC0 and FC1, where it reaches approximately 28%.
* The FC0 and FC1 layers generally have higher used weight percentages for all tasks compared to the convolutional layers (Conv0-Conv5).
### Interpretation
The data suggests that tasks T6, T11, T16, T21, T31, T36, and T40 utilize a large portion of the network's weights across all layers, indicating a more complex representation or a greater reliance on the features learned in those layers. Task T1, on the other hand, appears to be more sparse in its weight usage, potentially indicating a simpler representation or a focus on a smaller subset of features. The consistent low weight usage for T26 suggests a similar pattern. The higher weight usage in the fully connected layers (FC0 and FC1) for all tasks is expected, as these layers are responsible for the final classification or regression based on the features extracted by the convolutional layers. The duplication of the charts suggests a comparison or validation of the results. The data could be used to analyze the efficiency of the network for different tasks and potentially identify areas for pruning or compression.