## Bar Chart: Used Weights (%) Across Layers and T Values
### Overview
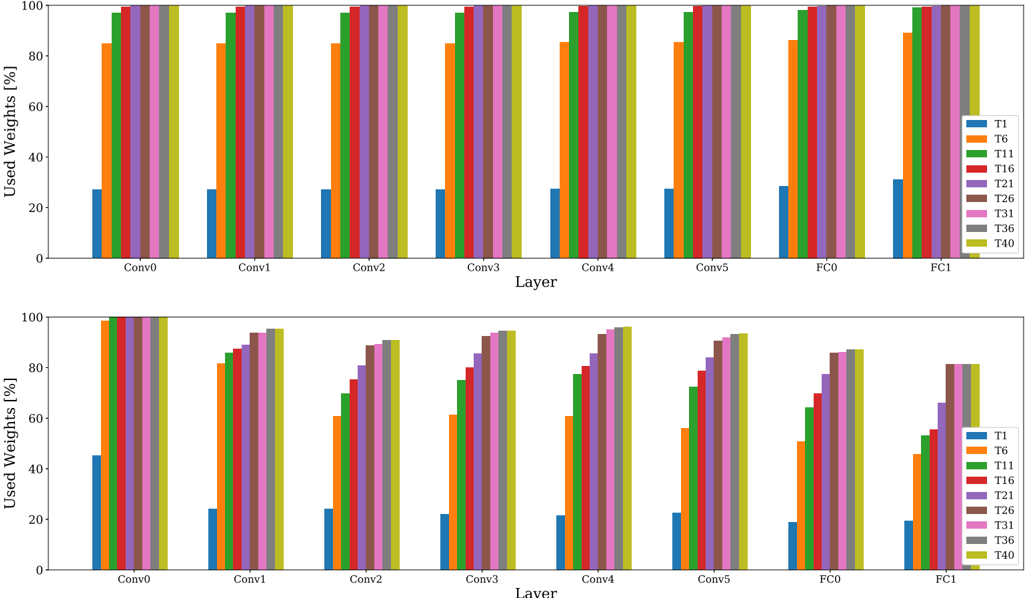
The image contains two vertically stacked bar charts comparing the percentage of used weights across different neural network layers (Conv0-FC1) for various T values (T1, T6, T11, T16, T21, T26, T31, T36, T40). Each subplot represents a category of layers: "Conv" (convolutional layers) and "FC" (fully connected layers). The y-axis ranges from 0% to 100%, and the x-axis lists layers with approximate values for each T value.
---
### Components/Axes
- **X-Axis (Layers)**:
- Top subplot: Conv0, Conv1, Conv2, Conv3, Conv4, Conv5, FC0, FC1
- Bottom subplot: Same labels as top subplot.
- **Y-Axis (Used Weights [%])**:
- Scale: 0% to 100% in increments of 20%.
- **Legend**:
- Colors correspond to T values:
- Blue: T1
- Orange: T6
- Green: T11
- Red: T16
- Purple: T21
- Brown: T26
- Pink: T31
- Gray: T36
- Yellow-green: T40
---
### Detailed Analysis
#### Top Subplot (Conv Layers)
- **T1 (Blue)**:
- All Conv layers: ~25% (stable across Conv0-Conv5).
- FC0: ~30%, FC1: ~35%.
- **T6 (Orange)**:
- Conv layers: ~85% (slightly decreasing from Conv0 to Conv5).
- FC0: ~88%, FC1: ~90%.
- **T11 (Green)**:
- Conv layers: ~98% (nearly flat).
- FC0: ~97%, FC1: ~96%.
- **T16 (Red)**:
- Conv layers: ~99% (slightly decreasing).
- FC0: ~98%, FC1: ~97%.
- **T21 (Purple)**:
- Conv layers: ~95% (slightly decreasing).
- FC0: ~94%, FC1: ~93%.
- **T26 (Brown)**:
- Conv layers: ~90% (slightly decreasing).
- FC0: ~89%, FC1: ~88%.
- **T31 (Pink)**:
- Conv layers: ~92% (slightly decreasing).
- FC0: ~91%, FC1: ~90%.
- **T36 (Gray)**:
- Conv layers: ~94% (slightly decreasing).
- FC0: ~93%, FC1: ~92%.
- **T40 (Yellow-green)**:
- Conv layers: ~96% (slightly decreasing).
- FC0: ~95%, FC1: ~94%.
#### Bottom Subplot (FC Layers)
- **T1 (Blue)**:
- FC0: ~30%, FC1: ~35%.
- **T6 (Orange)**:
- FC0: ~88%, FC1: ~90%.
- **T11 (Green)**:
- FC0: ~97%, FC1: ~96%.
- **T16 (Red)**:
- FC0: ~98%, FC1: ~97%.
- **T21 (Purple)**:
- FC0: ~94%, FC1: ~93%.
- **T26 (Brown)**:
- FC0: ~89%, FC1: ~88%.
- **T31 (Pink)**:
- FC0: ~91%, FC1: ~90%.
- **T36 (Gray)**:
- FC0: ~93%, FC1: ~92%.
- **T40 (Yellow-green)**:
- FC0: ~95%, FC1: ~94%.
---
### Key Observations
1. **T11 and T16 Dominance**:
- T11 and T16 consistently show the highest usage (~97-99%) across all layers, suggesting critical roles in the model.
2. **T1 Underutilization**:
- T1 remains the least utilized (~25-35%), possibly indicating lower importance or redundancy.
3. **FC Layers Slightly Higher Usage**:
- FC layers generally show 1-5% higher usage than Conv layers for most T values, except T1.
4. **Gradual Decline in Conv Layers**:
- Most T values exhibit a slight downward trend in Conv layers (e.g., T6 drops from ~85% to ~83% across Conv0-Conv5).
---
### Interpretation
- **Model Architecture Insights**:
- The high usage of T11 and T16 suggests these T values are pivotal for feature extraction or critical transformations in the network.
- The lower usage of T1 may reflect its role in less critical operations or potential inefficiencies.
- **Layer Type Impact**:
- FC layers’ slightly higher usage aligns with their role in final classification, where weight adjustments are more impactful.
- **Temporal Trends**:
- The gradual decline in Conv layers might indicate diminishing returns or saturation in deeper convolutional stages.
---
### Uncertainties
- Exact percentages are approximate due to the lack of numerical annotations on the bars.
- The relationship between T values and their functional roles in the model is inferred from usage patterns and requires further validation.