\n
## Bar Chart: AUROC Scores for Different Models and Token Positions
### Overview
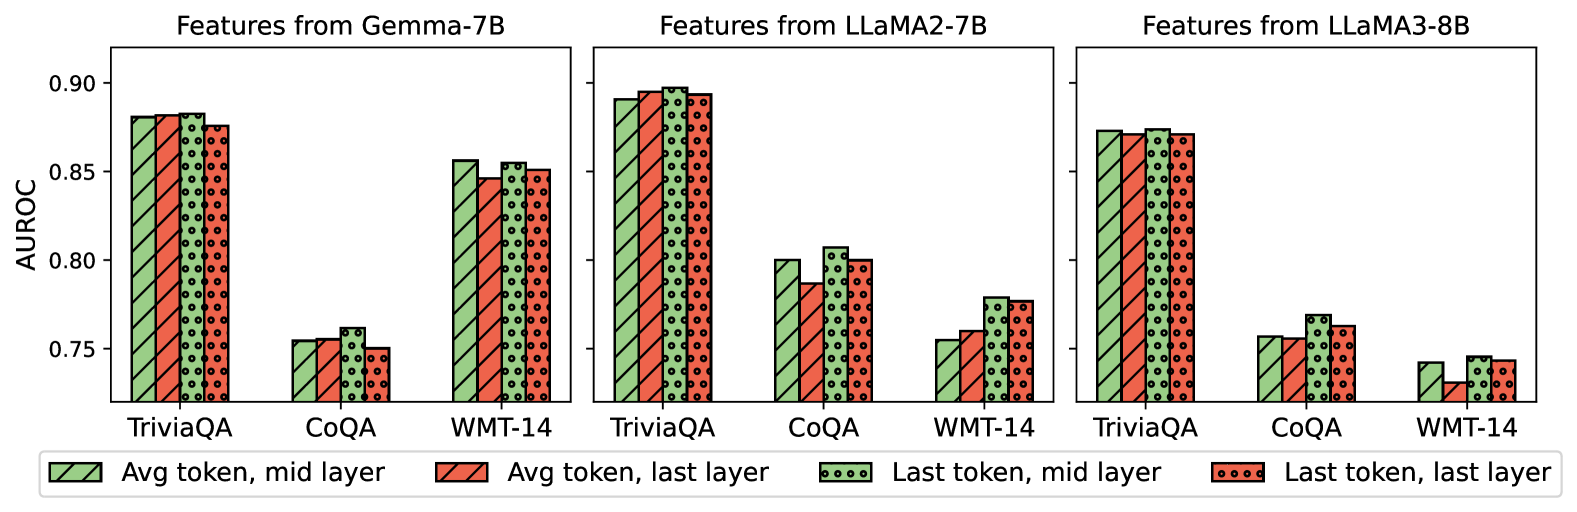
This image presents a comparative bar chart showing the Area Under the Receiver Operating Characteristic curve (AUROC) scores for three different language models – Gemma-7B, LLaMA2-7B, and LLaMA3-8B – across three datasets: TriviaQA, CoQA, and WMT-14. The chart compares performance based on features extracted from the average token at the mid-layer versus the last layer, and from the last token at the mid-layer versus the last layer. Each model has its own set of three bars for each dataset, representing these four feature configurations.
### Components/Axes
* **X-axis:** Datasets – TriviaQA, CoQA, WMT-14 (repeated for each model).
* **Y-axis:** AUROC score, ranging from approximately 0.74 to 0.91.
* **Chart Title:** Three separate titles, one for each model: "Features from Gemma-7B", "Features from LLaMA2-7B", and "Features from LLaMA3-8B".
* **Legend:** Located at the bottom of the image.
* Grey bars: "Avg token, mid layer"
* Red bars: "Avg token, last layer"
* Black dotted bars: "Last token, mid layer"
* Red dotted bars: "Last token, last layer"
### Detailed Analysis or Content Details
**Gemma-7B:**
* **TriviaQA:**
* Avg token, mid layer: Approximately 0.88
* Avg token, last layer: Approximately 0.89
* Last token, mid layer: Approximately 0.78
* Last token, last layer: Approximately 0.81
* **CoQA:**
* Avg token, mid layer: Approximately 0.82
* Avg token, last layer: Approximately 0.83
* Last token, mid layer: Approximately 0.76
* Last token, last layer: Approximately 0.78
* **WMT-14:**
* Avg token, mid layer: Approximately 0.79
* Avg token, last layer: Approximately 0.81
* Last token, mid layer: Approximately 0.75
* Last token, last layer: Approximately 0.76
**LLaMA2-7B:**
* **TriviaQA:**
* Avg token, mid layer: Approximately 0.90
* Avg token, last layer: Approximately 0.91
* Last token, mid layer: Approximately 0.77
* Last token, last layer: Approximately 0.79
* **CoQA:**
* Avg token, mid layer: Approximately 0.84
* Avg token, last layer: Approximately 0.85
* Last token, mid layer: Approximately 0.77
* Last token, last layer: Approximately 0.79
* **WMT-14:**
* Avg token, mid layer: Approximately 0.77
* Avg token, last layer: Approximately 0.78
* Last token, mid layer: Approximately 0.74
* Last token, last layer: Approximately 0.75
**LLaMA3-8B:**
* **TriviaQA:**
* Avg token, mid layer: Approximately 0.89
* Avg token, last layer: Approximately 0.90
* Last token, mid layer: Approximately 0.79
* Last token, last layer: Approximately 0.82
* **CoQA:**
* Avg token, mid layer: Approximately 0.83
* Avg token, last layer: Approximately 0.84
* Last token, mid layer: Approximately 0.76
* Last token, last layer: Approximately 0.77
* **WMT-14:**
* Avg token, mid layer: Approximately 0.76
* Avg token, last layer: Approximately 0.77
* Last token, mid layer: Approximately 0.73
* Last token, last layer: Approximately 0.74
### Key Observations
* For all models and datasets, using the "Avg token, last layer" consistently yields the highest AUROC scores.
* The "Last token, mid layer" consistently produces the lowest AUROC scores.
* LLaMA2-7B generally achieves the highest AUROC scores across all datasets, particularly on TriviaQA.
* WMT-14 consistently shows the lowest AUROC scores across all models.
* The difference between "mid layer" and "last layer" features is more pronounced for the average token than for the last token.
### Interpretation
The data suggests that features extracted from the average token at the last layer of these language models are most effective for discriminating between positive and negative examples in these tasks, as measured by AUROC. This could indicate that the final layers of these models capture more discriminative information relevant to the tasks. The lower performance of the "Last token, mid layer" features suggests that the last token alone may not contain sufficient information for accurate prediction, or that the mid-layers haven't fully converged on the task-specific features.
The superior performance of LLaMA2-7B suggests that its architecture or training data may be better suited for these tasks compared to Gemma-7B and LLaMA3-8B. The consistently lower scores on WMT-14 might indicate that this dataset is inherently more challenging for these models, potentially due to its complexity or the nature of the translation task. The consistent trend across all models and datasets highlights the importance of feature selection and layer choice in optimizing model performance.