TECHNICAL ASSET FINGERPRINT
770895f5d86a91be7314a054
Click to view fullscreen
Press ESC or click to close
FOUND IN PAPERS
EXPERT: healer-alpha-free VERSION 1
RUNTIME: free/openrouter/healer-alpha
INTEL_VERIFIED
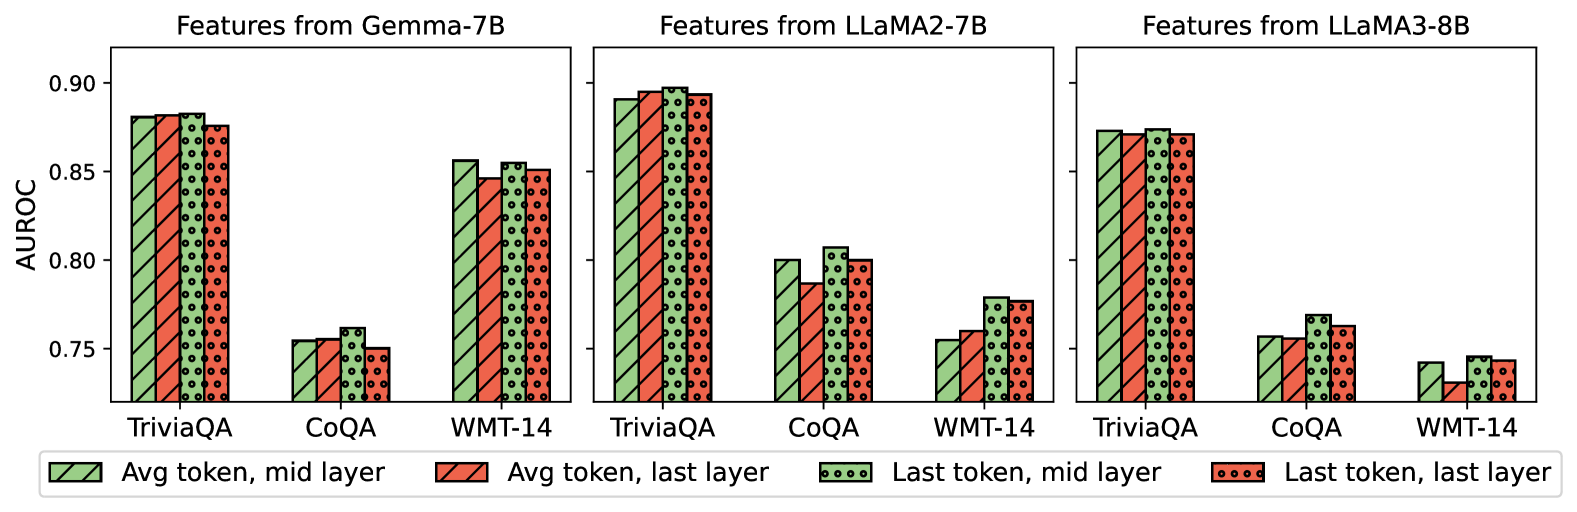
## Bar Chart Comparison: AUROC Performance of Three Language Models Across Datasets
### Overview
The image displays three grouped bar charts arranged horizontally, comparing the AUROC (Area Under the Receiver Operating Characteristic curve) performance of features extracted from three different large language models (LLMs) on three distinct datasets. The models are Gemma-7B, LLaMA2-7B, and LLaMA3-8B. For each model, performance is measured using four different feature extraction strategies, represented by bars with distinct colors and patterns.
### Components/Axes
* **Chart Titles (Top):** "Features from Gemma-7B" (left), "Features from LLaMA2-7B" (center), "Features from LLaMA3-8B" (right).
* **Y-Axis (Left):** Labeled "AUROC". The scale runs from approximately 0.75 to 0.90, with major tick marks at 0.75, 0.80, 0.85, and 0.90.
* **X-Axis (Bottom of each subplot):** Lists three datasets: "TriviaQA", "CoQA", and "WMT-14".
* **Legend (Bottom of entire figure):** Positioned below the three charts. It defines four feature extraction methods:
* **Green bar with diagonal stripes (\\):** "Avg token, mid layer"
* **Red bar with diagonal stripes (\\):** "Avg token, last layer"
* **Green bar with dots (.):** "Last token, mid layer"
* **Red bar with dots (.):** "Last token, last layer"
### Detailed Analysis
**1. Features from Gemma-7B (Left Chart):**
* **TriviaQA:** All four methods perform similarly high, with AUROC values clustered around 0.88. The "Last token, mid layer" (green dots) appears marginally highest (~0.885), while "Last token, last layer" (red dots) is slightly lower (~0.875).
* **CoQA:** Performance is notably lower than for TriviaQA. Values range from ~0.75 to ~0.76. "Last token, mid layer" (green dots) is the highest (~0.76), while the other three methods are very close, around 0.75.
* **WMT-14:** Performance is intermediate. "Avg token, mid layer" (green stripes) is highest (~0.855). "Last token, mid layer" (green dots) is close behind (~0.85). "Avg token, last layer" (red stripes) and "Last token, last layer" (red dots) are slightly lower, around 0.845-0.85.
**2. Features from LLaMA2-7B (Center Chart):**
* **TriviaQA:** Shows the highest overall performance in the entire figure. All four methods are very close, with AUROC values near or at 0.90. "Avg token, last layer" (red stripes) and "Last token, mid layer" (green dots) appear to be at the peak (~0.90).
* **CoQA:** Performance is lower. "Last token, mid layer" (green dots) is the highest (~0.81). "Avg token, mid layer" (green stripes) is next (~0.80). "Last token, last layer" (red dots) is ~0.80, and "Avg token, last layer" (red stripes) is the lowest (~0.79).
* **WMT-14:** Performance is the lowest among the three datasets for this model. "Last token, mid layer" (green dots) is highest (~0.78). "Last token, last layer" (red dots) is close (~0.775). "Avg token, last layer" (red stripes) is ~0.76, and "Avg token, mid layer" (green stripes) is the lowest (~0.755).
**3. Features from LLaMA3-8B (Right Chart):**
* **TriviaQA:** Performance is high but slightly lower than LLaMA2-7B on the same task. All four methods are tightly clustered around 0.87-0.875.
* **CoQA:** Performance is the lowest among the three models for this dataset. "Last token, mid layer" (green dots) is highest (~0.77). "Last token, last layer" (red dots) is ~0.76. "Avg token, mid layer" (green stripes) and "Avg token, last layer" (red stripes) are both around 0.755.
* **WMT-14:** Performance is the lowest across all models and datasets. "Last token, mid layer" (green dots) is highest (~0.745). "Last token, last layer" (red dots) is ~0.74. "Avg token, mid layer" (green stripes) is ~0.74, and "Avg token, last layer" (red stripes) is the lowest (~0.73).
### Key Observations
1. **Dataset Difficulty:** Across all three models, **TriviaQA consistently yields the highest AUROC scores** (approx. 0.87-0.90), followed by **WMT-14** (approx. 0.74-0.855), with **CoQA generally being the most challenging** (approx. 0.73-0.81).
2. **Model Comparison:** **LLaMA2-7B** appears to achieve the peak performance on TriviaQA (~0.90). **Gemma-7B** shows strong and consistent performance on TriviaQA and WMT-14. **LLaMA3-8B** shows a more pronounced drop in performance on the CoQA and WMT-14 datasets compared to the other two models.
3. **Feature Extraction Strategy:** The **"Last token, mid layer" (green dots) strategy is frequently the top or near-top performer** across most model-dataset combinations (e.g., Gemma on CoQA/WMT-14, LLaMA2 on CoQA/WMT-14, LLaMA3 on all). Using the **last layer (red bars) often results in slightly lower performance** compared to using the mid-layer (green bars) for the same token strategy.
4. **Token Strategy:** There is no universal winner between "Avg token" and "Last token" strategies; their relative performance varies by model and dataset. However, the "Last token" strategies (dotted bars) show a slight edge in more instances.
### Interpretation
This chart evaluates how effectively internal representations (features) from different LLMs can distinguish between correct and incorrect outputs on question-answering (TriviaQA, CoQA) and translation (WMT-14) tasks. The AUROC metric quantifies this discriminative power.
The data suggests that:
* **Task-Specific Feature Quality:** The features extracted from these models are most discriminative for the factual recall task (TriviaQA) and least for the conversational QA task (CoQA). This could indicate that the models' internal states more cleanly encode factual correctness than the nuanced correctness required in conversational contexts.
* **Layer and Token Selection Matters:** The consistent, often superior performance of features from the **mid-layer** (especially using the last token) implies that the most useful signal for error detection may reside in intermediate processing stages, not necessarily the final output layer. This aligns with the "layerwise" understanding of LLMs, where different layers specialize in different types of processing.
* **Model Architecture/Training Impact:** The performance differences between models (e.g., LLaMA2-7B's peak on TriviaQA vs. LLaMA3-8B's lower scores on CoQA/WMT-14) highlight that model scale (7B vs 8B parameters) is not the sole determinant of feature quality for these tasks. Differences in training data, architecture, or fine-tuning likely contribute significantly.
* **Practical Implication:** For building a classifier or detector that uses LLM features (e.g., for detecting hallucinations or errors), this analysis indicates that **extracting features from the mid-layer using the last token representation is a robust starting point**. The choice of source model should be guided by the specific target task (e.g., LLaMA2-7B for trivia-like tasks).
DECODING INTELLIGENCE...