## Line Chart: Performance of SymDQN Variants vs. Baseline Over Training Epochs
### Overview
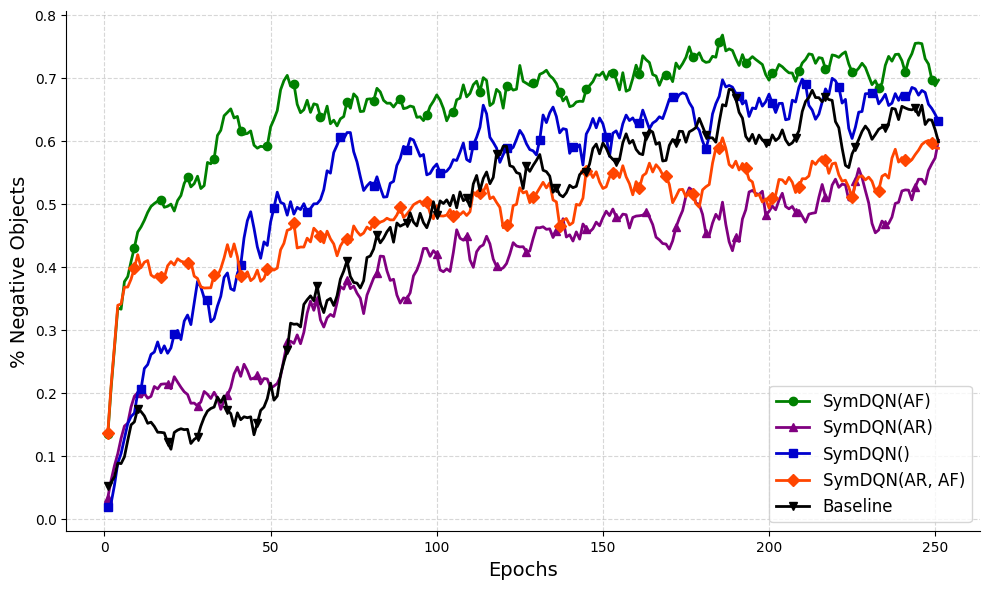
The image is a line chart comparing the performance of five different reinforcement learning algorithms over the course of 250 training epochs. The performance metric is the percentage of negative objects, where a higher percentage indicates better performance. The chart shows that all algorithms improve over time, but with distinct learning curves and final performance levels.
### Components/Axes
* **X-Axis (Horizontal):** Labeled "Epochs". It represents training time, ranging from 0 to 250 with major tick marks every 50 epochs (0, 50, 100, 150, 200, 250).
* **Y-Axis (Vertical):** Labeled "% Negative Objects". It represents the performance metric, ranging from 0.0 to 0.8 with major tick marks every 0.1 units (0.0, 0.1, 0.2, 0.3, 0.4, 0.5, 0.6, 0.7, 0.8).
* **Legend:** Located in the bottom-right corner of the chart area. It contains five entries, each associating a colored line with a specific algorithm name.
* Green line with circle markers: `SymDQN(AF)`
* Purple line with triangle-up markers: `SymDQN(AR)`
* Blue line with square markers: `SymDQN()`
* Orange line with diamond markers: `SymDQN(AR, AF)`
* Black line with triangle-down markers: `Baseline`
### Detailed Analysis
**Trend Verification & Data Points (Approximate):**
The following describes the visual trend for each series before listing approximate values.
1. **SymDQN(AF) (Green, circles):**
* **Trend:** Shows the fastest initial learning and maintains the highest performance throughout. It rises steeply from near 0, surpassing 0.5 by epoch ~25, and continues a generally upward, albeit noisy, trajectory.
* **Key Points:** Starts ~0.02. Reaches ~0.5 at epoch ~25. Peaks near ~0.76 around epoch 180. Ends at approximately 0.70 at epoch 250.
2. **SymDQN() (Blue, squares):**
* **Trend:** Demonstrates strong, steady growth. It starts low but climbs consistently, eventually becoming the second-best performer and closely approaching the top performer in the later stages.
* **Key Points:** Starts ~0.02. Crosses 0.4 around epoch 60. Reaches ~0.6 around epoch 120. Ends at approximately 0.68 at epoch 250.
3. **Baseline (Black, triangles down):**
* **Trend:** Shows a steady, monotonic increase with less volatility than the SymDQN variants. It starts very low but maintains a consistent upward slope, ending as the third-best performer.
* **Key Points:** Starts ~0.05. Reaches 0.3 around epoch 75. Hits 0.5 around epoch 130. Ends at approximately 0.65 at epoch 250.
4. **SymDQN(AR, AF) (Orange, diamonds):**
* **Trend:** Has a very rapid initial jump in the first ~10 epochs, then plateaus and grows more slowly with significant fluctuations. It generally performs below the Baseline and SymDQN() after the initial phase.
* **Key Points:** Starts ~0.14. Jumps to ~0.4 by epoch 10. Fluctuates between 0.4 and 0.5 for most of the training. Ends at approximately 0.60 at epoch 250.
5. **SymDQN(AR) (Purple, triangles up):**
* **Trend:** Exhibits the slowest overall growth and the lowest final performance. It has a gradual, noisy ascent and remains below all other methods for the majority of the training period.
* **Key Points:** Starts ~0.02. Reaches 0.2 around epoch 40. Hovers around 0.4-0.5 from epoch 100 onward. Ends at approximately 0.58 at epoch 250.
### Key Observations
* **Performance Hierarchy:** A clear and consistent ranking is established after approximately epoch 50 and holds until the end: SymDQN(AF) > SymDQN() > Baseline > SymDQN(AR, AF) > SymDQN(AR).
* **Convergence:** All lines show signs of plateauing or converging by epoch 250, though with continued noise. The gap between the top performer (SymDQN(AF)) and the others remains significant.
* **Initial Conditions:** SymDQN(AR, AF) starts at a notably higher value (~0.14) than the others (all near 0.02-0.05), suggesting a different initialization or an early advantage that is not sustained.
* **Volatility:** The SymDQN variants (green, blue, purple, orange) exhibit more volatility (higher frequency, larger amplitude fluctuations) in their learning curves compared to the smoother, more monotonic ascent of the Baseline (black).
### Interpretation
The data suggests that the `SymDQN(AF)` algorithm is the most effective method for maximizing the "% Negative Objects" metric in this specific task, demonstrating both fast learning and high final performance. The `SymDQN()` variant (without specified AR/AF components) is a strong second, eventually outperforming the `Baseline`.
The components `AR` and `AF` appear to have contrasting effects when added to the core SymDQN architecture:
* Adding `AF` alone (green line) yields the best results.
* Adding both `AR` and `AF` (orange line) provides a strong initial boost but leads to lower long-term performance and higher instability compared to the Baseline.
* Adding `AR` alone (purple line) results in the poorest performance, suggesting it may hinder learning in this context.
The `Baseline` method, while not the top performer, shows reliable and stable improvement, indicating it is a robust but potentially sub-optimal approach. The higher volatility in the SymDQN methods might reflect more aggressive exploration or sensitivity to batch data during training. The chart effectively demonstrates that architectural choices (the inclusion of AF/AR modules) significantly impact both the learning dynamics and the final outcome in this reinforcement learning scenario.