## Line Graph: % Negative Objects vs. Epochs
### Overview
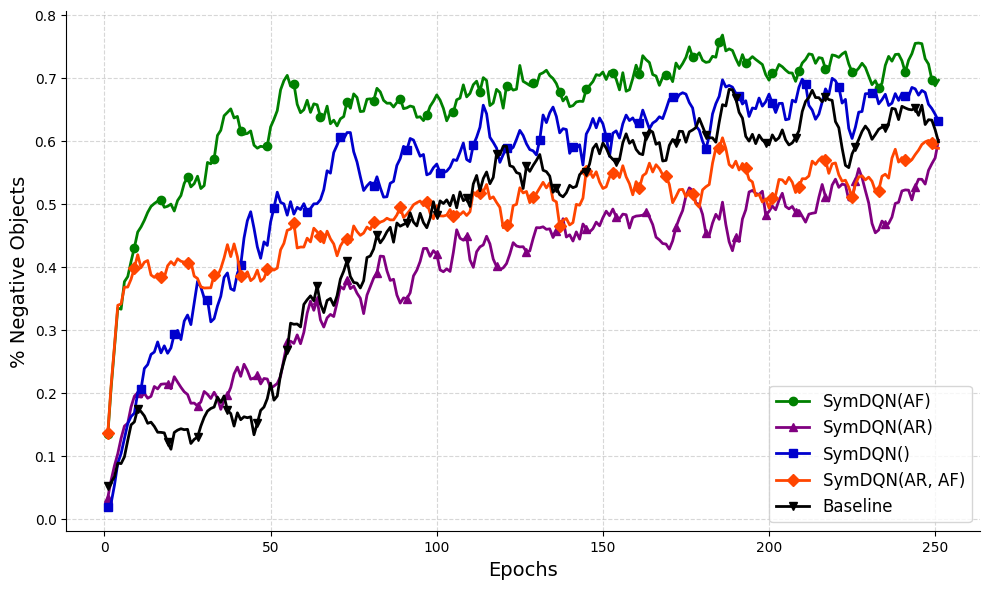
The image depicts a line graph comparing the performance of five different configurations over 250 epochs. The y-axis represents "% Negative Objects" (ranging from 0% to 0.8%), and the x-axis represents "Epochs" (0 to 250). Five distinct data series are plotted, each with unique colors and markers, showing varying trends in negative object percentages over time.
### Components/Axes
- **X-axis (Epochs)**: Labeled "Epochs," with ticks at 0, 50, 100, 150, 200, and 250.
- **Y-axis (% Negative Objects)**: Labeled "% Negative Objects," with ticks at 0.0, 0.1, 0.2, 0.3, 0.4, 0.5, 0.6, and 0.7.
- **Legend**: Located in the bottom-right corner, with the following entries:
- **SymDQN(AF)**: Green line with circular markers.
- **SymDQN(AR)**: Purple line with triangular markers.
- **SymDQN()**: Blue line with square markers.
- **SymDQN(AR, AF)**: Orange line with diamond markers.
- **Baseline**: Black line with triangular markers.
### Detailed Analysis
1. **SymDQN(AF) (Green)**:
- Starts at ~0.35% at epoch 0.
- Peaks at ~0.7% by epoch 250, maintaining the highest values throughout.
- Shows moderate fluctuations but remains consistently above other series.
2. **SymDQN(AR) (Purple)**:
- Begins at ~0.1% at epoch 0.
- Rises steadily to ~0.55% by epoch 250.
- Exhibits sharper fluctuations compared to SymDQN(AF).
3. **SymDQN() (Blue)**:
- Starts at ~0.05% at epoch 0.
- Increases to ~0.65% by epoch 250.
- Shows significant variability, with peaks and troughs.
4. **SymDQN(AR, AF) (Orange)**:
- Begins at ~0.15% at epoch 0.
- Reaches ~0.6% by epoch 250.
- Follows a relatively smooth upward trend with minor oscillations.
5. **Baseline (Black)**:
- Starts at ~0.1% at epoch 0.
- Ends at ~0.65% by epoch 250.
- Displays erratic fluctuations, with values often overlapping other series.
### Key Observations
- **SymDQN(AF)** consistently outperforms all other configurations, maintaining the highest % Negative Objects.
- **SymDQN(AR, AF)** shows the second-highest performance, with a steady increase.
- The **Baseline** exhibits the most variability, suggesting less stability compared to other configurations.
- **SymDQN(AR)** and **SymDQN()** demonstrate similar trends but with distinct fluctuation patterns.
### Interpretation
The data suggests that the **SymDQN(AF)** configuration is the most effective at maintaining higher % Negative Objects over time, potentially indicating superior performance in the evaluated task. The **Baseline**'s erratic behavior implies that the tested configurations generally outperform the default or control scenario. The **SymDQN(AR, AF)** configuration bridges the gap between the top-performing SymDQN(AF) and the others, highlighting the impact of combining AR and AF adjustments. The variability in SymDQN() and SymDQN(AR) suggests that additional tuning or context-specific factors may influence their effectiveness.