# Technical Document Extraction: Dust Temperature vs. Redshift Analysis
## Axis Labels and Markers
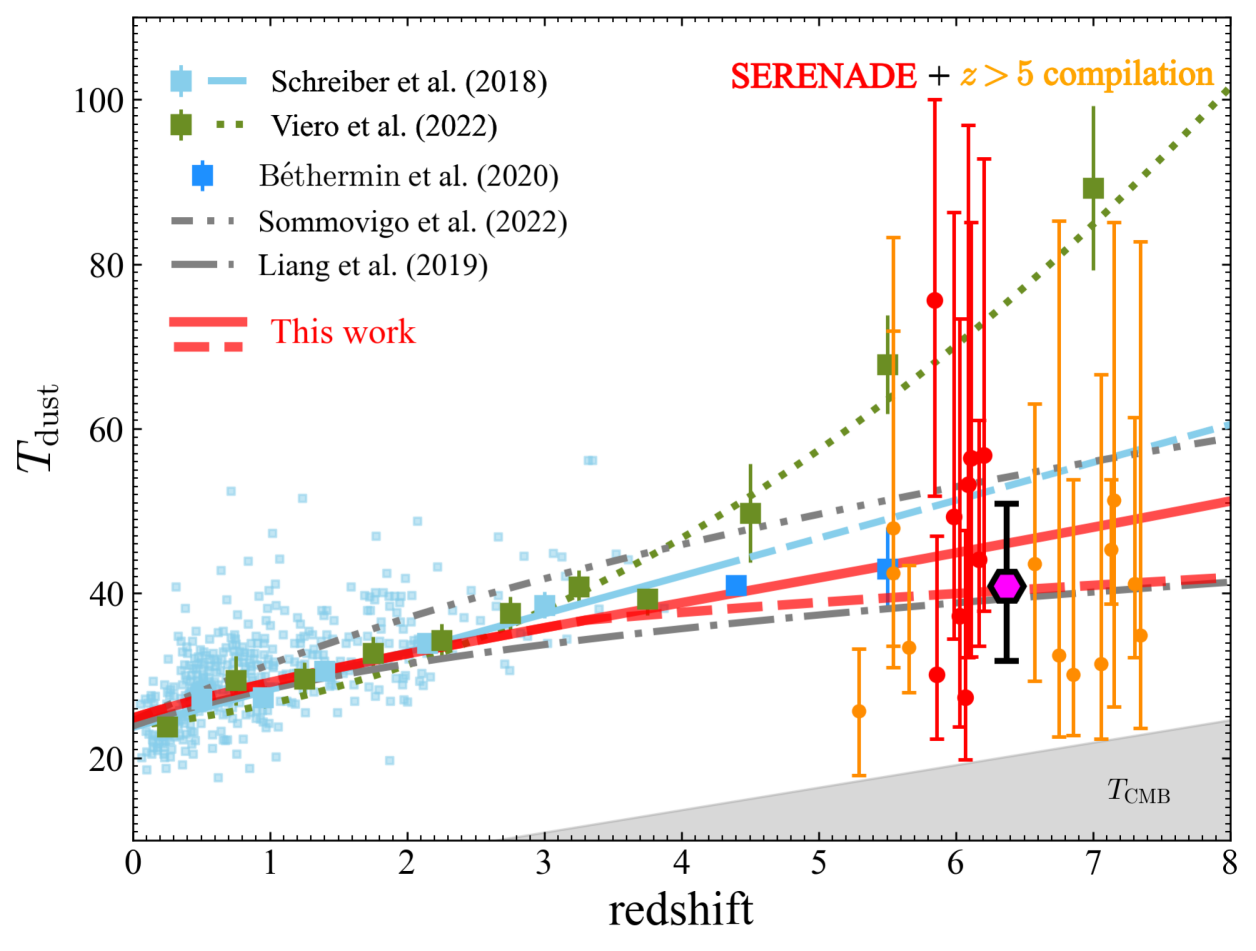
- **X-axis**: "redshift" (linear scale from 0 to 8)
- **Y-axis**: "T_dust" (dust temperature in Kelvin, linear scale from 20 to 100)
- **Shaded Region**: Labeled "T_CMB" (Cosmic Microwave Background temperature baseline), spanning redshift 5 to 8
## Legend and Data Series
Legend located in the **top-right corner** (coordinates: [x=6.5, y=95]). Colors and markers cross-referenced with data series:
| Legend Label | Color/Marker | Data Series Placement |
|-----------------------------|--------------------|------------------------------------------------|
| Schreiber et al. (2018) | Blue squares | Scatter points clustered at lower redshifts |
| Viero et al. (2022) | Green squares | Scatter points with dashed trend line |
| Béthermin et al. (2020) | Blue circles | Scatter points at mid-to-high redshifts |
| Sommovigo et al. (2022) | Gray dashed line | Trend line with moderate upward slope |
| Liang et al. (2019) | Gray solid line | Trend line with steepest upward slope |
| This work | Red solid line | Primary trend line with error bars |
| SERENEDE + z > 5 compilation| Red vertical line | Vertical marker at redshift 6 |
## Key Trends and Data Points
1. **Primary Trend ("This work")**:
- Red solid line with error bars
- Slope: Gradual increase in T_dust with redshift
- Key point: T_dust ≈ 40 K at redshift 6 (central value of error bar cluster)
2. **Compilation Data (SERENEDE + z > 5)**:
- Vertical red line at redshift 6
- Orange circles with large error bars (T_dust ≈ 50–70 K range)
- Spatial grounding: Overlaps with "This work" trend line at z=6
3. **Comparative Studies**:
- **Schreiber et al. (2018)**: Blue squares show scatter at z < 3, T_dust < 40 K
- **Viero et al. (2022)**: Green squares with dashed line show steeper T_dust increase (T_dust ≈ 30–60 K across z=1–7)
- **Béthermin et al. (2020)**: Blue circles cluster at z=4–6, T_dust ≈ 40–50 K
- **Sommovigo et al. (2022)**: Gray dashed line shows moderate correlation (T_dust ≈ 30–50 K)
- **Liang et al. (2019)**: Gray solid line shows strongest correlation (T_dust ≈ 25–60 K)
## Spatial Analysis
- **Legend Position**: Top-right corner (x=6.5, y=95) – ensures visibility without obscuring data
- **Shaded Region**: T_CMB baseline (gray area) spans z=5–8, indicating theoretical lower limit for dust temperature
- **Vertical Marker**: Red line at z=6 anchors SERENEDE compilation data
## Error Bars and Uncertainty
- **SERENEDE Data**: Orange circles exhibit largest error bars (vertical: ±10 K, horizontal: ±0.5 redshift)
- **Other Studies**: Error bars not explicitly shown for individual points, but trend lines suggest moderate uncertainty
## Language and Transcription
- All text in English. No non-English content detected.
- Transcribed terms: "T_CMB" (Cosmic Microwave Background temperature), "SERENEDE" (likely an acronym for a specific observational campaign or dataset)
## Component Isolation
1. **Header**: Legend and title ("SERENEDE + z > 5 compilation")
2. **Main Chart**: Scatter plot with trend lines and shaded region
3. **Footer**: X-axis extends to z=8, but no data points beyond z=7
## Conclusion
The plot illustrates a positive correlation between dust temperature (T_dust) and redshift, with "This work" (red line) showing the most consistent trend. SERENEDE compilation data at z > 5 (orange circles) aligns with this trend but exhibits higher uncertainty. Comparative studies (blue/green squares, gray lines) provide context for model variations across redshift ranges.