# Technical Document Extraction: Spectrogram Analysis
## 1. Axis Labels and Markers
- **X-Axis (Horizontal):**
- Label: `Time (s)`
- Markers: `0, 20, 40, 60, 80, 100, 120` (evenly spaced intervals)
- **Y-Axis (Vertical):**
- Label: `Frequency (Hz)`
- Markers: `0, 10, 20, 30` (linear scale)
## 2. Color Gradient and Intensity
- **Color Scale:**
- Blue (dark) → Red (bright): Represents signal intensity (lower to higher).
- No explicit legend present; color mapping inferred from gradient.
## 3. Key Trends and Data Points
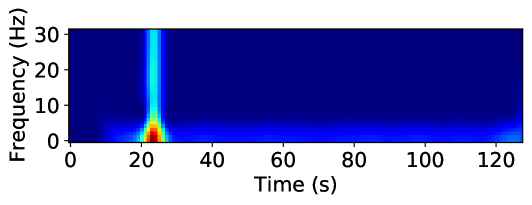
- **Dominant Feature:**
- A vertical bright line at **~20 seconds** (x-axis) with a sharp transition from blue to red.
- **Peak Frequency:** ~25 Hz (y-axis) at the center of the bright line.
- **Duration:** The bright line spans approximately **5 seconds** (20–25 seconds on x-axis).
- **Background:**
- Uniform dark blue across all other regions, indicating negligible signal activity.
## 4. Spatial Grounding and Component Isolation
- **Legend:**
- **Absent** in the image. Color interpretation relies on gradient context.
- **Regions:**
- **Header:** No text or labels.
- **Main Chart:** Spectrogram heatmap with time-frequency data.
- **Footer:** No text or labels.
## 5. Trend Verification
- **Bright Line (20–25s):**
- **Visual Trend:** Sharp upward spike in intensity (blue → red) at ~20s, peaking at ~25 Hz.
- **Data Points:**
- At **20s**: Intensity begins to rise (~10 Hz).
- At **22.5s**: Peak intensity (~25 Hz).
- At **25s**: Intensity declines back to baseline.
- **Other Regions:**
- No discernible trends; background remains static at low intensity.
## 6. Missing Elements
- **Data Table:** Not present.
- **Embedded Text:** None.
- **Additional Languages:** English only.
## 7. Summary
The spectrogram depicts a transient high-frequency event (~25 Hz) occurring between **20–25 seconds**, with no other significant activity observed. The absence of a legend necessitates reliance on the color gradient for intensity interpretation.