## Line Graph: Llama-3.1-8B
### Overview
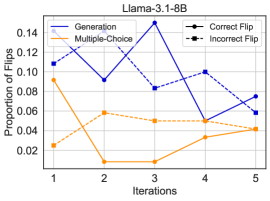
The image is a line graph comparing two data series ("Generation" and "Multiple-Choice") across five iterations. The y-axis represents the "Proportion of Flips" (0.02–0.14), and the x-axis represents "Iterations" (1–5). A legend in the top-right corner distinguishes the two series, with additional labels for "Correct Flip" and "Incorrect Flip" (not plotted as data points).
---
### Components/Axes
- **X-axis (Iterations)**: Labeled "Iterations" with markers at 1, 2, 3, 4, 5.
- **Y-axis (Proportion of Flips)**: Labeled "Proportion of Flips" with increments of 0.02 (0.02, 0.04, ..., 0.14).
- **Legend**: Located in the top-right corner.
- Solid blue line with circles = "Generation"
- Dashed orange line with squares = "Multiple-Choice"
- Black dot = "Correct Flip" (not plotted)
- Black square = "Incorrect Flip" (not plotted)
---
### Detailed Analysis
#### Generation (Blue Line)
- **Iteration 1**: ~0.11
- **Iteration 2**: Peaks at ~0.14
- **Iteration 3**: Drops to ~0.08
- **Iteration 4**: Rises to ~0.10
- **Iteration 5**: Declines to ~0.06
#### Multiple-Choice (Orange Line)
- **Iteration 1**: ~0.09
- **Iteration 2**: Sharp drop to ~0.02
- **Iteration 3**: Remains flat at ~0.02
- **Iteration 4**: Rises to ~0.04
- **Iteration 5**: Slight increase to ~0.04
---
### Key Observations
1. **Generation** exhibits high volatility, with a peak at iteration 2 and a trough at iteration 3, followed by a partial recovery.
2. **Multiple-Choice** shows a dramatic drop at iteration 2, stabilizing until iteration 3, then a gradual rise.
3. The "Correct Flip" and "Incorrect Flip" labels in the legend are not visually represented in the graph, suggesting they may relate to unplotted data or annotations.
---
### Interpretation
- The **Generation** series demonstrates instability in flip proportions, potentially indicating inconsistent performance or external variability across iterations.
- The **Multiple-Choice** series suggests a correction or adjustment after iteration 2, with a steady improvement from iteration 3 onward.
- The absence of plotted data for "Correct Flip" and "Incorrect Flip" implies these categories might be part of a separate analysis or require additional context (e.g., a secondary metric not visualized here).
- The divergence between the two series highlights differing behaviors: Generation’s fluctuation vs. Multiple-Choice’s stabilization and recovery.