## Line Chart: Llama-3.1-8B
### Overview
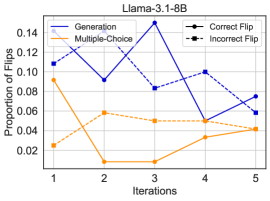
The image is a line chart comparing the proportion of flips across iterations for different methods (Generation vs. Multiple-Choice) and flip types (Correct Flip vs. Incorrect Flip) for the Llama-3.1-8B model.
### Components/Axes
* **Title:** Llama-3.1-8B
* **X-axis:** Iterations (labeled 1 to 5)
* **Y-axis:** Proportion of Flips (ranging from 0.02 to 0.14)
* **Legend (top-left):**
* **Blue solid line:** Generation
* **Orange solid line:** Multiple-Choice
* **Legend (top-right):**
* **Black solid line with circle markers:** Correct Flip
* **Black dashed line with square markers:** Incorrect Flip
### Detailed Analysis
* **Generation (Blue solid line):**
* Trend: Initially increases, peaks at iteration 3, then decreases.
* Data Points:
* Iteration 1: ~0.11
* Iteration 2: ~0.09
* Iteration 3: ~0.15
* Iteration 4: ~0.08
* Iteration 5: ~0.06
* **Multiple-Choice (Orange solid line):**
* Trend: Decreases sharply from iteration 1 to 2, remains low until iteration 4, then increases.
* Data Points:
* Iteration 1: ~0.09
* Iteration 2: ~0.01
* Iteration 3: ~0.01
* Iteration 4: ~0.03
* Iteration 5: ~0.04
* **Correct Flip (Black solid line with circle markers):**
* Trend: Increases slightly from iteration 4 to 5.
* Data Points:
* Iteration 5: ~0.075
* **Incorrect Flip (Black dashed line with square markers):**
* Trend: Decreases from iteration 1 to 4, then increases slightly.
* Data Points:
* Iteration 1: ~0.11
* Iteration 2: ~0.06
* Iteration 3: ~0.05
* Iteration 4: ~0.05
* Iteration 5: ~0.07
### Key Observations
* The Generation method shows a peak in the proportion of flips at iteration 3.
* The Multiple-Choice method has a significantly lower proportion of flips compared to the Generation method, especially between iterations 2 and 4.
* The proportion of incorrect flips is higher than the proportion of correct flips.
### Interpretation
The chart illustrates the performance of the Llama-3.1-8B model in terms of the proportion of flips during different iterations for Generation and Multiple-Choice methods. The Generation method initially struggles but stabilizes, while the Multiple-Choice method consistently performs better with a lower proportion of flips. The higher proportion of incorrect flips suggests that the model is more prone to making mistakes during the flipping process. The data suggests that the Multiple-Choice method is more reliable for this model in terms of minimizing flips.