\n
## Line Chart: Proportion of Flips vs. Iterations (Llama-3.1-8B)
### Overview
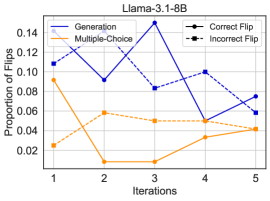
This line chart depicts the proportion of flips across different iterations for various methods: Generation, Multiple-Choice, Correct Flip, and Incorrect Flip. The chart aims to show how these proportions change as the number of iterations increases. The title "Llama-3.1-8B" suggests this data relates to a language model with 8 billion parameters.
### Components/Axes
* **X-axis:** Iterations (labeled 1 to 5).
* **Y-axis:** Proportion of Flips (scale ranging from 0 to 0.14).
* **Data Series:**
* Generation (Blue solid line)
* Multiple-Choice (Orange solid line)
* Correct Flip (Black dashed line)
* Incorrect Flip (Dark Blue dashed line)
* **Legend:** Located in the top-right corner, associating colors with each data series.
### Detailed Analysis
Let's analyze each data series individually, noting trends and approximate values.
* **Generation (Blue solid line):** This line exhibits a fluctuating trend. It starts at approximately 0.12 at Iteration 1, decreases to around 0.09 at Iteration 2, rises sharply to a peak of approximately 0.14 at Iteration 3, then declines to around 0.05 at Iteration 4, and finally increases slightly to about 0.07 at Iteration 5.
* **Multiple-Choice (Orange solid line):** This line shows a decreasing trend overall. It begins at approximately 0.02 at Iteration 1, drops to around 0.01 at Iteration 2, increases slightly to about 0.05 at Iteration 2, then decreases to approximately 0.01 at Iteration 3, rises to about 0.03 at Iteration 4, and finally increases to approximately 0.05 at Iteration 5.
* **Correct Flip (Black dashed line):** This line generally increases with fluctuations. It starts at approximately 0.10 at Iteration 1, decreases to around 0.09 at Iteration 2, increases to about 0.10 at Iteration 3, decreases to approximately 0.08 at Iteration 4, and rises to about 0.07 at Iteration 5.
* **Incorrect Flip (Dark Blue dashed line):** This line shows a decreasing trend with some fluctuations. It begins at approximately 0.08 at Iteration 1, decreases to around 0.07 at Iteration 2, increases to about 0.09 at Iteration 3, decreases to approximately 0.05 at Iteration 4, and rises to about 0.06 at Iteration 5.
### Key Observations
* The "Generation" method initially has the highest proportion of flips, but this proportion fluctuates significantly across iterations.
* The "Multiple-Choice" method consistently has the lowest proportion of flips throughout all iterations.
* The "Correct Flip" and "Incorrect Flip" methods have proportions that are relatively close to each other, with "Correct Flip" generally being slightly higher.
* Iteration 3 appears to be a turning point for both "Generation" and "Incorrect Flip", where their proportions reach peaks or valleys.
### Interpretation
The data suggests that the "Generation" method is the most sensitive to changes in iterations, exhibiting the largest fluctuations in the proportion of flips. This could indicate that the generation process is more susceptible to instability or requires more fine-tuning. The consistently low proportion of flips for the "Multiple-Choice" method suggests that this approach is more stable or less prone to errors. The relationship between "Correct Flip" and "Incorrect Flip" indicates a trade-off between making correct adjustments and introducing errors during the iterative process. The fluctuations observed across all methods suggest that the iterative process is not always converging towards a stable solution and may require further investigation to understand the underlying dynamics. The model "Llama-3.1-8B" appears to be undergoing a process of refinement or adjustment, as evidenced by the changing proportions of flips across iterations. The data could be used to optimize the iterative process and improve the performance of the language model.