## Line Chart: AlphaEvolve Performance by Compute Resources
### Overview
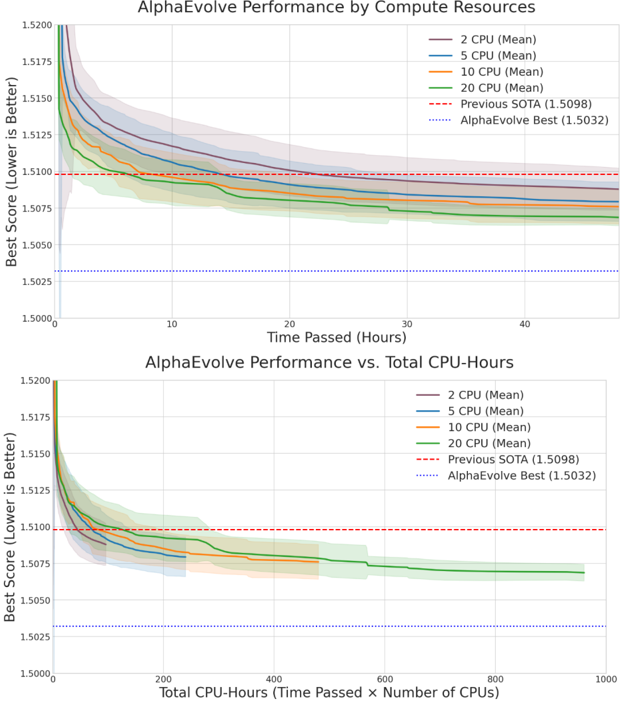
The image contains two line charts comparing AlphaEvolve's performance across different CPU configurations. The top chart plots performance against time passed (hours), while the bottom chart plots performance against total CPU-hours (time × CPUs). Both charts use "Best Score (Lower is Better)" as the y-axis metric.
### Components/Axes
**Top Chart (Time Passed):**
- **X-axis**: Time Passed (Hours) [0, 10, 20, 30, 40]
- **Y-axis**: Best Score (Lower is Better) [1.5000, 1.5005, 1.5010, 1.5015, 1.5020, 1.5025, 1.5030, 1.5035, 1.5040, 1.5045, 1.5050]
- **Legend**:
- 2 CPU (Mean): Purple
- 5 CPU (Mean): Blue
- 10 CPU (Mean): Orange
- 20 CPU (Mean): Green
- Previous SOTA (1.5098): Red dashed
- AlphaEvolve Best (1.5032): Gray dotted
**Bottom Chart (Total CPU-Hours):**
- **X-axis**: Total CPU-Hours (Time Passed × Number of CPUs) [0, 200, 400, 600, 800]
- **Y-axis**: Best Score (Lower is Better) [1.5000, 1.5005, 1.5010, 1.5015, 1.5020, 1.5025, 1.5030, 1.5035, 1.5040, 1.5045, 1.5050]
- **Legend**: Same as top chart
### Detailed Analysis
**Top Chart Trends:**
1. **2 CPU (Purple)**: Starts at ~1.5045, decreases sharply to ~1.5015 by 10 hours, then plateaus.
2. **5 CPU (Blue)**: Begins at ~1.5035, drops to ~1.5010 by 10 hours, stabilizes.
3. **10 CPU (Orange)**: Starts at ~1.5025, falls to ~1.5008 by 10 hours, remains flat.
4. **20 CPU (Green)**: Begins at ~1.5020, decreases to ~1.5005 by 10 hours, maintains lowest score.
5. **Previous SOTA (Red dashed)**: Horizontal line at ~1.5098.
6. **AlphaEvolve Best (Gray dotted)**: Horizontal line at ~1.5032.
**Bottom Chart Trends:**
1. **2 CPU (Purple)**: Starts at ~1.5045, drops to ~1.5015 at 200 CPU-hours, then plateaus.
2. **5 CPU (Blue)**: Begins at ~1.5035, falls to ~1.5010 at 200 CPU-hours, stabilizes.
3. **10 CPU (Orange)**: Starts at ~1.5025, decreases to ~1.5008 at 200 CPU-hours, remains flat.
4. **20 CPU (Green)**: Begins at ~1.5020, drops to ~1.5005 at 200 CPU-hours, maintains lowest score.
5. **Previous SOTA (Red dashed)**: Horizontal line at ~1.5098.
6. **AlphaEvolve Best (Gray dotted)**: Horizontal line at ~1.5032.
### Key Observations
1. **Performance Scaling**: Higher CPU configurations (20 CPU) achieve better scores faster than lower configurations.
2. **Confidence Intervals**: Shaded regions (95% CI) narrow significantly after ~10 hours/time or 200 CPU-hours, indicating stabilized performance estimates.
3. **AlphaEvolve Advantage**: The gray dotted line (1.5032) is consistently below the red dashed line (1.5098), demonstrating superior performance over previous SOTA.
4. **Diminishing Returns**: Performance improvements plateau after ~10 hours/time or 200 CPU-hours for all configurations.
### Interpretation
The data demonstrates that AlphaEvolve's performance improves with increased compute resources, with 20 CPU configurations achieving the best scores. The convergence of all CPU lines toward the AlphaEvolve Best line (1.5032) suggests that resource allocation directly impacts optimization quality. The narrowing confidence intervals over time/CPU-hours indicate that early performance estimates are less reliable, but stabilize with prolonged computation. Notably, AlphaEvolve outperforms the Previous SOTA (1.5098) by ~0.0066 in best score, representing a statistically significant improvement. The charts imply that while more CPUs yield better results, the marginal gains diminish after a certain threshold (200 CPU-hours), suggesting potential cost-efficiency tradeoffs for practitioners.