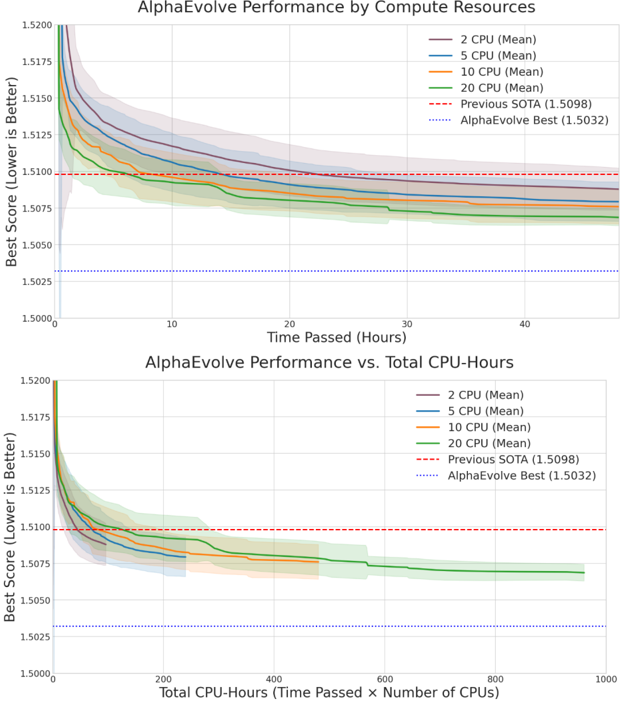
## Line Chart: AlphaEvolve Performance
### Overview
The image presents two line charts comparing the performance of AlphaEvolve using different compute resources. The top chart shows performance (Best Score, where lower is better) over time in hours, while the bottom chart shows performance against total CPU-hours. Both charts include lines representing 2 CPU, 5 CPU, 10 CPU, and 20 CPU configurations, along with horizontal lines indicating the "Previous SOTA" (State of the Art) score and the "AlphaEvolve Best" score. Shaded regions around each CPU line represent the variance or uncertainty in the performance.
### Components/Axes
**Top Chart:**
* **Title:** AlphaEvolve Performance by Compute Resources
* **X-axis:** Time Passed (Hours), ranging from 0 to 40.
* **Y-axis:** Best Score (Lower is Better), ranging from 1.5000 to 1.5200.
* **Legend:** Located in the top-right corner.
* 2 CPU (Mean) - Brown line
* 5 CPU (Mean) - Blue line
* 10 CPU (Mean) - Orange line
* 20 CPU (Mean) - Green line
* Previous SOTA (1.5098) - Red dashed line
* AlphaEvolve Best (1.5032) - Blue dotted line
**Bottom Chart:**
* **Title:** AlphaEvolve Performance vs. Total CPU-Hours
* **X-axis:** Total CPU-Hours (Time Passed x Number of CPUs), ranging from 0 to 1000.
* **Y-axis:** Best Score (Lower is Better), ranging from 1.5000 to 1.5200.
* **Legend:** Located in the top-right corner, identical to the top chart.
* 2 CPU (Mean) - Brown line
* 5 CPU (Mean) - Blue line
* 10 CPU (Mean) - Orange line
* 20 CPU (Mean) - Green line
* Previous SOTA (1.5098) - Red dashed line
* AlphaEvolve Best (1.5032) - Blue dotted line
### Detailed Analysis
**Top Chart (Performance vs. Time):**
* **2 CPU (Mean) - Brown:** Starts at approximately 1.519 and decreases rapidly initially, then plateaus around 1.508 after 20 hours.
* **5 CPU (Mean) - Blue:** Starts at approximately 1.518 and decreases rapidly, then plateaus around 1.507 after 20 hours.
* **10 CPU (Mean) - Orange:** Starts at approximately 1.516 and decreases rapidly, then plateaus around 1.507 after 20 hours.
* **20 CPU (Mean) - Green:** Starts at approximately 1.514 and decreases rapidly, then plateaus around 1.507 after 20 hours.
* **Previous SOTA (1.5098) - Red Dashed:** A horizontal line at 1.5098.
* **AlphaEvolve Best (1.5032) - Blue Dotted:** A horizontal line at 1.5032.
**Bottom Chart (Performance vs. CPU-Hours):**
* **2 CPU (Mean) - Brown:** Starts at approximately 1.519 and decreases rapidly initially, then plateaus around 1.508 after 400 CPU-Hours.
* **5 CPU (Mean) - Blue:** Starts at approximately 1.518 and decreases rapidly, then plateaus around 1.507 after 400 CPU-Hours.
* **10 CPU (Mean) - Orange:** Starts at approximately 1.516 and decreases rapidly, then plateaus around 1.507 after 400 CPU-Hours.
* **20 CPU (Mean) - Green:** Starts at approximately 1.514 and decreases rapidly, then plateaus around 1.507 after 400 CPU-Hours.
* **Previous SOTA (1.5098) - Red Dashed:** A horizontal line at 1.5098.
* **AlphaEvolve Best (1.5032) - Blue Dotted:** A horizontal line at 1.5032.
### Key Observations
* All CPU configurations show a rapid initial improvement in the Best Score, followed by a plateau.
* Higher CPU counts (20 CPU) generally achieve slightly better initial scores.
* The performance plateaus around the same Best Score (approximately 1.507) for all CPU configurations.
* AlphaEvolve Best (1.5032) is significantly better than the Previous SOTA (1.5098).
### Interpretation
The charts demonstrate that increasing compute resources (more CPUs) leads to a slightly better initial performance for AlphaEvolve. However, the performance improvement diminishes over time, and all configurations eventually plateau at a similar Best Score. The "AlphaEvolve Best" score indicates a significant improvement over the "Previous SOTA," suggesting that AlphaEvolve, regardless of the CPU configuration, can achieve superior results. The CPU-Hours chart suggests that there's a point of diminishing returns; after a certain number of CPU-hours, increasing the total compute doesn't significantly improve the best score.