## Line Chart: AlphaEvolve Performance
### Overview
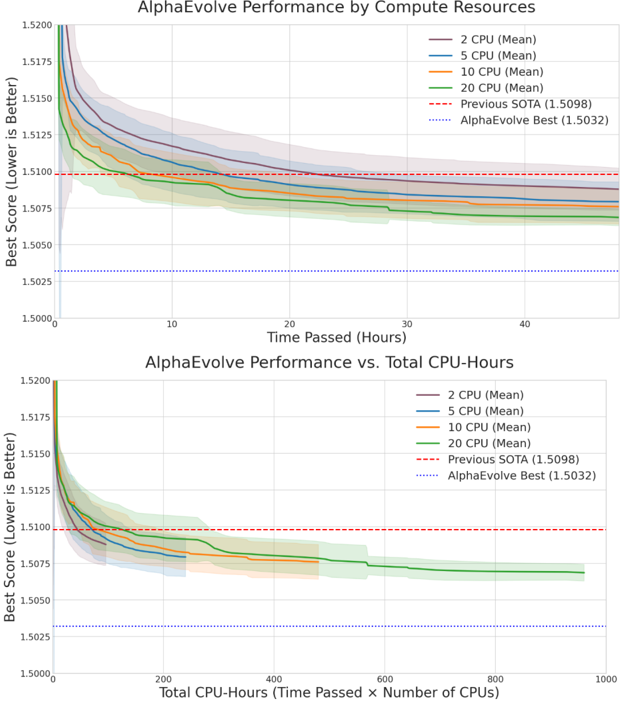
The image presents two line charts illustrating the performance of AlphaEvolve, a system or algorithm, under varying compute resource conditions. The first chart plots "Best Score" against "Time Passed (Hours)", while the second plots "Best Score" against "Total CPU-Hours". Both charts include performance comparisons against a "Previous SOTA" (State of the Art) and the "AlphaEvolve Best" score.
### Components/Axes
**Chart 1: AlphaEvolve Performance by Compute Resources**
* **X-axis:** Time Passed (Hours), ranging from 0 to approximately 45 hours.
* **Y-axis:** Best Score (Lower is Better), ranging from 1.5000 to 1.5200.
* **Legend (Top-Right):**
* 2 CPU (Mean) - Orange Line
* 5 CPU (Mean) - Blue Line
* 10 CPU (Mean) - Light Green Line
* 20 CPU (Mean) - Yellow Line
* Previous SOTA (1.5098) - Black Dotted Line
* AlphaEvolve Best (1.5032) - Gray Dotted Line
**Chart 2: AlphaEvolve Performance vs. Total CPU-Hours**
* **X-axis:** Total CPU-Hours (Time Passed x Number of CPUs), ranging from 0 to approximately 1000.
* **Y-axis:** Best Score (Lower is Better), ranging from 1.5000 to 1.5200.
* **Legend (Top-Right):** Identical to Chart 1.
### Detailed Analysis or Content Details
**Chart 1: AlphaEvolve Performance by Compute Resources**
* **2 CPU (Orange):** Starts at approximately 1.5185 and decreases to approximately 1.5060 over 45 hours. The line exhibits a steep initial decline, followed by a flattening trend.
* **5 CPU (Blue):** Starts at approximately 1.5175 and decreases to approximately 1.5050 over 45 hours. Similar to the 2 CPU line, it shows a rapid initial decrease and then plateaus.
* **10 CPU (Light Green):** Starts at approximately 1.5160 and decreases to approximately 1.5040 over 45 hours. The decline is less pronounced than the 2 and 5 CPU lines.
* **20 CPU (Yellow):** Starts at approximately 1.5150 and decreases to approximately 1.5030 over 45 hours. This line shows the most gradual decline.
* **Previous SOTA (Black Dotted):** A horizontal line at 1.5098.
* **AlphaEvolve Best (Gray Dotted):** A horizontal line at 1.5032.
**Chart 2: AlphaEvolve Performance vs. Total CPU-Hours**
* **2 CPU (Orange):** Starts at approximately 1.5185 and decreases to approximately 1.5060 at 1000 CPU-Hours.
* **5 CPU (Blue):** Starts at approximately 1.5175 and decreases to approximately 1.5050 at 1000 CPU-Hours.
* **10 CPU (Light Green):** Starts at approximately 1.5160 and decreases to approximately 1.5040 at 1000 CPU-Hours.
* **20 CPU (Yellow):** Starts at approximately 1.5150 and decreases to approximately 1.5030 at 1000 CPU-Hours.
* **Previous SOTA (Black Dotted):** A horizontal line at 1.5098.
* **AlphaEvolve Best (Gray Dotted):** A horizontal line at 1.5032.
### Key Observations
* In both charts, increasing CPU resources leads to a more gradual performance improvement (less steep decline in "Best Score").
* The 2 CPU configuration shows the most significant initial improvement, but also appears to plateau earlier.
* The 20 CPU configuration exhibits the slowest improvement rate, but consistently outperforms the other configurations over longer durations.
* All configurations surpass the "Previous SOTA" score.
* The 20 CPU configuration approaches the "AlphaEvolve Best" score.
* The lines converge as time/CPU-hours increase, suggesting diminishing returns from additional compute resources.
### Interpretation
These charts demonstrate the scaling behavior of the AlphaEvolve algorithm with respect to compute resources. The initial rapid improvement observed across all CPU configurations suggests that the algorithm benefits significantly from increased parallelism in the early stages of execution. However, the flattening of the curves indicates that the benefits of adding more CPUs diminish over time, likely due to factors such as communication overhead or inherent limitations in the algorithm's parallelizability.
The fact that all configurations outperform the "Previous SOTA" suggests that AlphaEvolve represents a substantial advancement in the field. The convergence of the lines towards the "AlphaEvolve Best" score implies that the optimal performance is achievable with sufficient compute resources and time. The choice of CPU configuration represents a trade-off between initial speed and ultimate performance. A lower CPU count (e.g., 2) might be preferable for quick initial results, while a higher CPU count (e.g., 20) could be more suitable for achieving the best possible score over a longer period. The data suggests that the algorithm is compute-bound, meaning its performance is primarily limited by the available processing power.