## Line Charts: AlphaEvolve Performance Analysis
### Overview
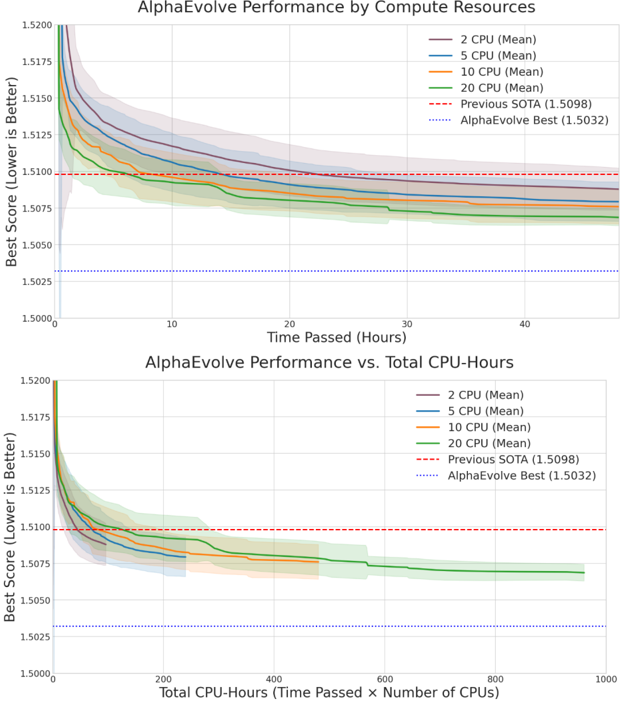
The image contains two vertically stacked line charts analyzing the performance of a system called "AlphaEvolve." Both charts plot the "Best Score" (where a lower value indicates better performance) against different measures of computational resource usage. The charts compare performance across four different CPU allocations (2, 5, 10, and 20 CPUs) and include two benchmark reference lines.
### Components/Axes
**Common Elements (Both Charts):**
* **Y-Axis:** Label: "Best Score (Lower is Better)". Scale: Linear, ranging from 1.5000 to 1.5200, with major ticks at 0.0025 intervals (1.5000, 1.5025, 1.5050, 1.5075, 1.5100, 1.5125, 1.5150, 1.5175, 1.5200).
* **Legend (Top-Right of each plot):**
* `2 CPU (Mean)`: Solid purple line with a light purple shaded confidence interval.
* `5 CPU (Mean)`: Solid blue line with a light blue shaded confidence interval.
* `10 CPU (Mean)`: Solid orange line with a light orange shaded confidence interval.
* `20 CPU (Mean)`: Solid green line with a light green shaded confidence interval.
* `Previous SOTA (1.5098)`: Red dashed horizontal line.
* `AlphaEvolve Best (1.5032)`: Blue dotted horizontal line.
* **Reference Lines:**
* The red dashed "Previous SOTA" line is fixed at y = 1.5098.
* The blue dotted "AlphaEvolve Best" line is fixed at y = 1.5032.
**Chart 1 (Top):**
* **Title:** "AlphaEvolve Performance by Compute Resources"
* **X-Axis:** Label: "Time Passed (Hours)". Scale: Linear, from 0 to 40 hours, with major ticks at 0, 10, 20, 30, 40.
**Chart 2 (Bottom):**
* **Title:** "AlphaEvolve Performance vs. Total CPU-Hours"
* **X-Axis:** Label: "Total CPU-Hours (Time Passed × Number of CPUs)". Scale: Linear, from 0 to 1000 CPU-hours, with major ticks at 0, 200, 400, 600, 800, 1000.
### Detailed Analysis
**Chart 1: Performance vs. Time**
* **Trend Verification:** All four CPU configuration lines show a steep downward slope (improving score) initially, which gradually flattens over time. The lines for higher CPU counts (20, 10) descend more rapidly and reach lower scores sooner than those for lower CPU counts (5, 2).
* **Data Points & Relationships:**
* At Time ≈ 0, all lines start near a score of 1.5200.
* The **20 CPU (green)** line crosses below the "Previous SOTA" (1.5098) line at approximately 2-3 hours. It approaches and nearly converges with the "AlphaEvolve Best" (1.5032) line by the 40-hour mark, ending at an approximate score of 1.5035.
* The **10 CPU (orange)** line crosses below "Previous SOTA" at around 5-6 hours. By 40 hours, it reaches an approximate score of 1.5070.
* The **5 CPU (blue)** line crosses below "Previous SOTA" at around 10-12 hours. By 40 hours, it reaches an approximate score of 1.5085.
* The **2 CPU (purple)** line crosses below "Previous SOTA" at around 20-22 hours. By 40 hours, it reaches an approximate score of 1.5100.
* **Uncertainty (Shaded Areas):** The shaded confidence intervals are widest at the beginning (high uncertainty) and narrow significantly over time for all series. The 2 CPU series maintains the widest interval throughout.
**Chart 2: Performance vs. Total CPU-Hours**
* **Trend Verification:** When plotted against total computational work (CPU-hours), the performance curves for different CPU allocations become much closer together. All lines still show a downward trend, but the advantage of higher parallelism is less pronounced.
* **Data Points & Relationships:**
* The x-axis now represents the product of time and CPU count.
* The **20 CPU (green)** line, which used the most total resources, extends to nearly 1000 CPU-hours and achieves the best final score (~1.5035).
* The **10 CPU (orange)** line extends to about 500 CPU-hours (40 hrs * 10 CPUs) with a final score of ~1.5070.
* The **5 CPU (blue)** line extends to about 200 CPU-hours (40 hrs * 5 CPUs) with a final score of ~1.5085.
* The **2 CPU (purple)** line extends to about 80 CPU-hours (40 hrs * 2 CPUs) with a final score of ~1.5100.
* All lines cross the "Previous SOTA" threshold within the first 100-150 total CPU-hours.
### Key Observations
1. **Diminishing Returns with Parallelism:** While more CPUs lead to faster wall-clock time improvement (Chart 1), the efficiency per unit of total compute decreases. Achieving the same score with 20 CPUs requires disproportionately more total CPU-hours than with fewer CPUs.
2. **Convergence to a Limit:** All configurations appear to be converging towards the "AlphaEvolve Best" score of 1.5032, but at vastly different rates. The 20 CPU setup is closest to this apparent performance limit.
3. **Reduced Variability Over Time:** The narrowing shaded regions indicate that the system's performance becomes more consistent and predictable as it runs longer, regardless of the CPU allocation.
4. **Benchmark Context:** The "Previous SOTA" (1.5098) is surpassed by all tested configurations given sufficient time, but the "AlphaEvolve Best" (1.5032) represents a significantly more challenging target that only the highest-resource setup approaches closely.
### Interpretation
The data demonstrates a classic trade-off in parallel computing for optimization tasks. **AlphaEvolve** benefits significantly from increased parallel resources (more CPUs), which dramatically reduces the *time to solution*. However, this speedup comes at the cost of reduced *computational efficiency*; the total work (CPU-hours) required to reach a given performance level increases with parallelism.
The charts suggest that the "Previous SOTA" benchmark of 1.5098 is relatively easy to surpass with this method, while the "AlphaEvolve Best" of 1.5032 represents a much higher barrier, likely requiring either extensive wall-clock time or a large investment in parallel resources. The narrowing confidence intervals imply the algorithm stabilizes and converges reliably. For a project manager, this data is crucial for resource allocation: choosing between a quick result with many CPUs or a more compute-efficient result with fewer CPUs over a longer period. The performance ceiling (around 1.5032) may indicate a fundamental limit of the current algorithm or problem representation.