\n
## Scatter Plot: Timing vs. Guess
### Overview
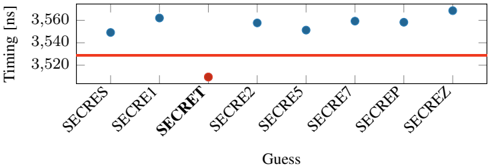
The image presents a scatter plot illustrating the relationship between "Guess" (labeled on the x-axis) and "Timing" measured in nanoseconds (ns), on the y-axis. The plot shows timing measurements for several guesses labeled "SECRET", "SECRET1" through "SECRET8". A horizontal line is also present, likely representing a threshold or baseline timing value.
### Components/Axes
* **X-axis:** "Guess" with markers: SECRET, SECRET1, SECRET2, SECRET5, SECRET7, SECREPe, SECREZ.
* **Y-axis:** "Timing [ns]" ranging from approximately 3520 ns to 3570 ns.
* **Data Points:** Blue circles representing timing measurements for each guess.
* **Threshold Line:** A horizontal red line.
* **Outlier:** A single red data point for "SECRET2".
### Detailed Analysis
The plot displays timing values for eight different guesses. The majority of the guesses ("SECRET", "SECRET1", "SECRET5", "SECRET7", "SECREPe", "SECREZ") exhibit timing values clustered between approximately 3550 ns and 3570 ns. The red horizontal line is positioned at approximately 3525 ns.
Here's a breakdown of the approximate timing values for each guess:
* SECRET: ~3555 ns
* SECRET1: ~3552 ns
* SECRET2: ~3522 ns (Red data point)
* SECRET5: ~3558 ns
* SECRET7: ~3562 ns
* SECREPe: ~3560 ns
* SECREZ: ~3568 ns
The data points for "SECRET", "SECRET1", "SECRET5", "SECRET7", "SECREPe", and "SECREZ" are visually consistent, showing a relatively flat distribution. The timing for "SECRET2" is significantly lower than the others, falling below the red threshold line.
### Key Observations
* "SECRET2" is a clear outlier, exhibiting a substantially lower timing value compared to all other guesses.
* The timing values for the other guesses are relatively consistent, suggesting a similar processing time for those inputs.
* The red horizontal line may represent a timing threshold, and "SECRET2" falls below this threshold.
### Interpretation
The data suggests that the guess "SECRET2" is processed significantly faster than the other guesses. This could indicate a difference in the complexity of "SECRET2" compared to the others, or potentially a vulnerability or optimization related to that specific guess. The consistent timing values for the other guesses suggest a standard processing time for those inputs. The red line likely represents a performance benchmark or a security threshold. The fact that "SECRET2" falls below this threshold is noteworthy and warrants further investigation. It could be a sign of a successful attack or a unique characteristic of that particular guess. The plot demonstrates a potential timing-based side-channel vulnerability, where the time taken to process a guess reveals information about the guess itself.