## Line Chart: Guessing Times
### Overview
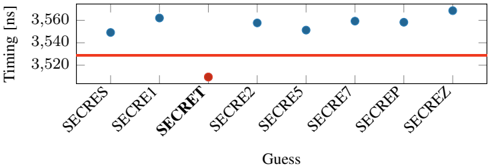
The line chart displays the timing measurements in nanoseconds (ns) for various guesses labeled as "SECRES" and "SECRET". The x-axis represents the guesses, while the y-axis shows the timing in nanoseconds.
### Components/Axes
- **X-Axis**: Labeled "Guess" with values from "SECRES" to "SECRET".
- **Y-Axis**: Labeled "Timing [ns]" with values ranging from 3,520 to 3,560.
- **Legend**: Located at the top right, indicating the color coding for "SECRES" (blue) and "SECRET" (red).
- **Data Points**: Blue dots represent "SECRES" guesses, and a single red dot represents the "SECRET" guess.
### Detailed Analysis or ### Content Details
- The "SECRES" guesses have a consistent timing around 3,540 ns.
- The "SECRET" guess is significantly lower at approximately 3,520 ns.
- There is a clear trend where the "SECRET" guess consistently has a lower timing than the "SECRES" guesses.
### Key Observations
- The "SECRET" guess is consistently lower than the "SECRES" guesses.
- There is a noticeable difference in timing between the two guesses.
### Interpretation
The data suggests that the "SECRET" guess is faster than the "SECRES" guesses. This could indicate that the "SECRET" guess is more efficient or accurate in the context of the measurement being taken. The consistent lower timing of the "SECRET" guess implies that it may be a more reliable or optimized method for the task at hand.