## Scatter Plot: Test Set Accuracy vs. Number of Network Parameters
### Overview
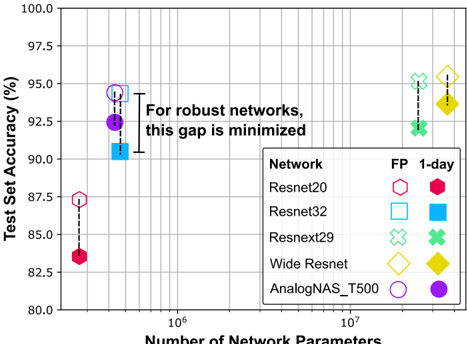
This image is a scatter plot comparing the "Test Set Accuracy (%)" against the "Number of Network Parameters" for five different neural network architectures. The chart compares two training/precision modes: "FP" (Full Precision, represented by hollow markers) and "1-day" (represented by solid, filled markers). The x-axis uses a logarithmic scale. An annotation highlights that the performance gap between these two modes is minimized for "robust networks," specifically pointing to the AnalogNAS_T500 model.
### Components/Axes
* **Y-Axis:** "Test Set Accuracy (%)". Linear scale ranging from 80.0 to 100.0, with major grid lines at 2.5% intervals.
* **X-Axis:** "Number of Network Parameters". Logarithmic scale.
* **Legend (Located in the bottom-right quadrant):**
* **Columns:** "FP" (Hollow markers) and "1-day" (Solid/Filled markers).
* **Rows (Networks):**
* **Resnet20:** Red/Pink Hexagon
* **Resnet32:** Light Blue Square
* **Resnext29:** Light Green 'X'
* **Wide Resnet:** Yellow/Gold Diamond
* **AnalogNAS_T500:** Purple Circle
* **Annotation:** A vertical bracket connects the two AnalogNAS_T500 data points (Purple Circle) with the text: "For robust networks, this gap is minimized".
### Detailed Analysis
The data is clustered into two distinct groups along the x-axis. Vertical dashed lines connect the FP and 1-day markers for each network, visually representing the accuracy drop.
**Cluster 1 (Left, approx. $4 \times 10^5$ to $5 \times 10^5$ parameters):**
* **Resnet20 (Red Hexagon):**
* FP: ~87.5%
* 1-day: ~83.5%
* *Trend:* Significant drop of ~4.0%.
* **Resnet32 (Blue Square):**
* FP: ~94.5%
* 1-day: ~90.5%
* *Trend:* Significant drop of ~4.0%.
* **AnalogNAS_T500 (Purple Circle):**
* FP: ~94.5%
* 1-day: ~92.5%
* *Trend:* Moderate drop of ~2.0%.
**Cluster 2 (Right, approx. $2 \times 10^7$ to $3 \times 10^7$ parameters):**
* **Resnext29 (Green 'X'):**
* FP: ~95.5%
* 1-day: ~92.0%
* *Trend:* Significant drop of ~3.5%.
* **Wide Resnet (Yellow Diamond):**
* FP: ~95.5%
* 1-day: ~93.5%
* *Trend:* Moderate drop of ~2.0%.
### Key Observations
* **Performance Penalty:** In every instance, the "1-day" training mode results in lower accuracy than the "FP" (Full Precision) mode.
* **Gap Variance:** The magnitude of the accuracy drop varies by architecture.
* **Robustness:** The annotation explicitly identifies the AnalogNAS_T500 as a "robust network" because the vertical distance (the gap) between its FP and 1-day markers is smaller than that of the Resnet20 and Resnet32 models in the same parameter cluster.
* **Parameter Scaling:** The models are grouped by parameter count, with Resnet20, Resnet32, and AnalogNAS_T500 being smaller models, and Resnext29 and Wide Resnet being larger models.
### Interpretation
The data demonstrates a trade-off between model complexity (parameter count) and training precision. The "1-day" training regime appears to be a constrained or quantized training method that inherently degrades performance compared to Full Precision (FP).
The inclusion of the annotation regarding "robust networks" suggests that the primary goal of the AnalogNAS_T500 architecture is to maintain high accuracy even when subjected to the constraints of the "1-day" training regime. While Resnet32 achieves a similar FP accuracy to AnalogNAS_T500, it suffers a much larger performance degradation when switched to the "1-day" mode. Therefore, the chart serves as evidence that AnalogNAS_T500 is superior in terms of stability/robustness under these specific training constraints, despite having a similar parameter count to the other models in its cluster.