## Line Chart: Heading Difference vs. Step Number for Different Model Variants
### Overview
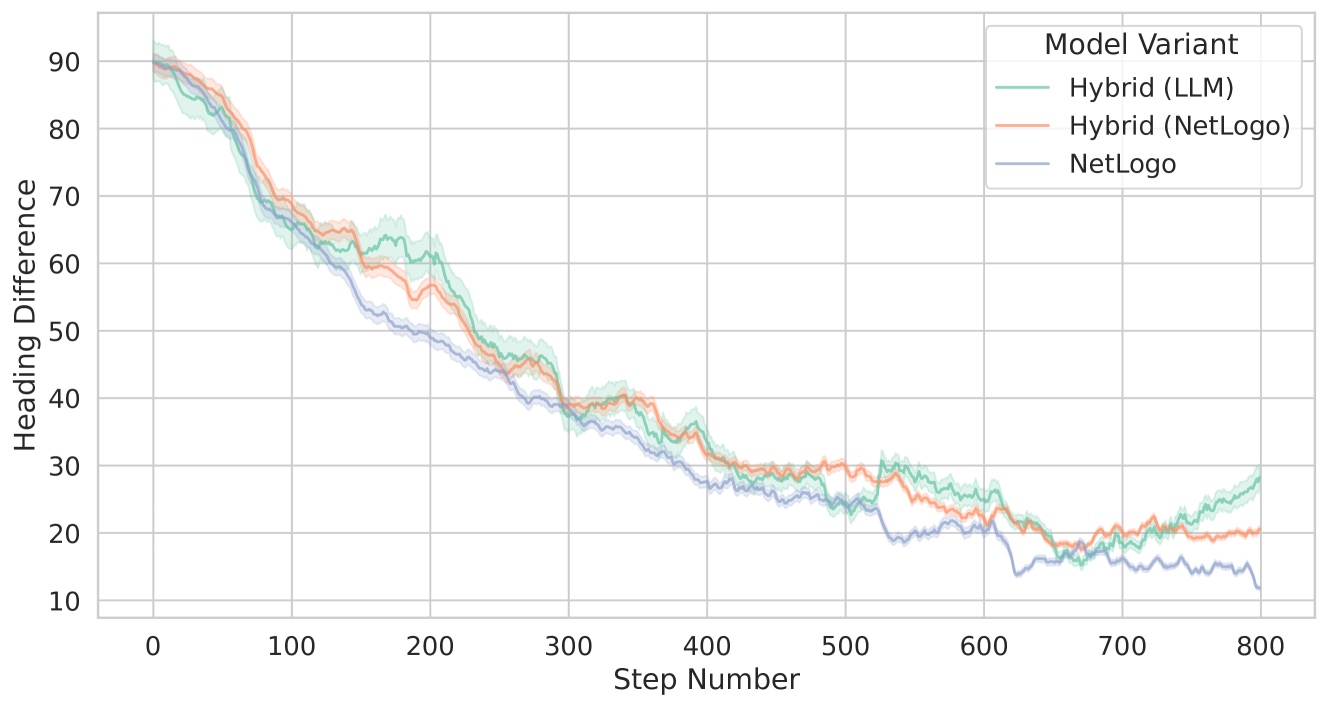
The image is a line chart comparing the "Heading Difference" over "Step Number" for three different model variants: "Hybrid (LLM)", "Hybrid (NetLogo)", and "NetLogo". The chart displays how the heading difference changes over 800 steps for each model. The lines are surrounded by shaded regions, indicating uncertainty or variance in the data.
### Components/Axes
* **Title:** There is no explicit title on the chart.
* **X-axis:** "Step Number", ranging from 0 to 800 in increments of 100.
* **Y-axis:** "Heading Difference", ranging from 10 to 90 in increments of 10.
* **Legend:** Located in the top-right corner, labeled "Model Variant".
* **Hybrid (LLM):** Represented by a light green line with a light green shaded region.
* **Hybrid (NetLogo):** Represented by a light orange line with a light orange shaded region.
* **NetLogo:** Represented by a light blue line with a light blue shaded region.
### Detailed Analysis
* **Hybrid (LLM) - Light Green:**
* Trend: Initially decreases sharply from approximately 90 at step 0 to around 60 at step 100. It continues to decrease, but at a slower rate, reaching approximately 45 at step 300. From step 300 to 600, it fluctuates between 30 and 40. After step 600, it shows a slight increase, ending around 25 at step 800.
* Data Points:
* Step 0: ~90
* Step 100: ~60
* Step 300: ~45
* Step 600: ~30
* Step 800: ~25
* **Hybrid (NetLogo) - Light Orange:**
* Trend: Similar to "Hybrid (LLM)", it starts at approximately 90 at step 0 and decreases sharply to around 65 at step 100. It continues to decrease, reaching approximately 45 at step 300. From step 300 to 600, it fluctuates between 25 and 35. After step 600, it shows a slight increase, ending around 20 at step 800.
* Data Points:
* Step 0: ~90
* Step 100: ~65
* Step 300: ~45
* Step 600: ~25
* Step 800: ~20
* **NetLogo - Light Blue:**
* Trend: Starts at approximately 90 at step 0 and decreases sharply to around 65 at step 100. It continues to decrease, reaching approximately 45 at step 300. From step 300 to 600, it fluctuates between 20 and 30. After step 600, it shows a slight increase, ending around 15 at step 800.
* Data Points:
* Step 0: ~90
* Step 100: ~65
* Step 300: ~45
* Step 600: ~20
* Step 800: ~15
### Key Observations
* All three model variants show a decreasing trend in "Heading Difference" as "Step Number" increases.
* The most significant decrease occurs within the first 300 steps for all models.
* After 600 steps, all models show a slight increase in "Heading Difference".
* The "NetLogo" model generally has a lower "Heading Difference" compared to the "Hybrid (LLM)" and "Hybrid (NetLogo)" models, especially after step 300.
* The shaded regions around each line indicate the variability or uncertainty associated with each model's performance.
### Interpretation
The data suggests that as the number of steps increases, the "Heading Difference" tends to decrease for all model variants. This could indicate that the models are converging or becoming more aligned in their heading as they run for a longer duration. The "NetLogo" model appears to perform slightly better in terms of achieving a lower "Heading Difference" compared to the hybrid models, particularly in the later steps. The shaded regions highlight the variability in the models' performance, which could be due to various factors such as randomness in the environment or differences in the models' internal mechanisms. The slight increase in "Heading Difference" after 600 steps could indicate a potential instability or exploration phase in the models' behavior.