## Line Chart: Heading Difference vs. Step Number
### Overview
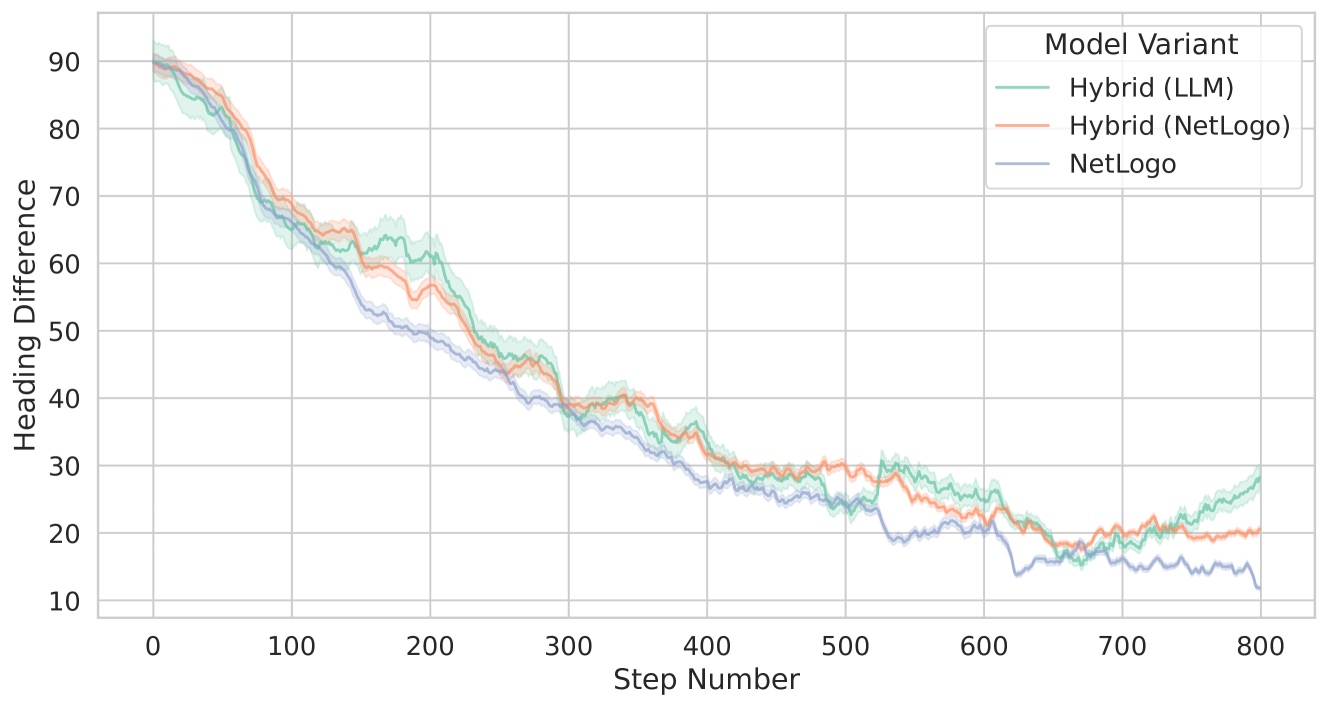
The image presents a line chart illustrating the "Heading Difference" across "Step Number" for three different "Model Variants". The chart displays the decreasing trend of heading difference as the step number increases, suggesting a convergence of headings over time.
### Components/Axes
* **X-axis:** "Step Number", ranging from 0 to 800, with gridlines at intervals of 100.
* **Y-axis:** "Heading Difference", ranging from 10 to 90, with gridlines at intervals of 10.
* **Legend (Top-Right):**
* "Hybrid (LLM)" - Red line
* "Hybrid (NetLogo)" - Green line
* "NetLogo" - Blue line
### Detailed Analysis
The chart shows three lines representing the heading difference for each model variant as a function of the step number.
* **Hybrid (LLM) - Red Line:** The line starts at approximately 88 at Step Number 0 and generally decreases.
* At Step Number 100: Approximately 62
* At Step Number 200: Approximately 45
* At Step Number 300: Approximately 32
* At Step Number 400: Approximately 26
* At Step Number 500: Approximately 21
* At Step Number 600: Approximately 18
* At Step Number 700: Approximately 17
* At Step Number 800: Approximately 22
* **Hybrid (NetLogo) - Green Line:** The line begins at approximately 86 at Step Number 0 and exhibits a decreasing trend.
* At Step Number 100: Approximately 60
* At Step Number 200: Approximately 43
* At Step Number 300: Approximately 30
* At Step Number 400: Approximately 24
* At Step Number 500: Approximately 19
* At Step Number 600: Approximately 16
* At Step Number 700: Approximately 18
* At Step Number 800: Approximately 24
* **NetLogo - Blue Line:** The line starts at approximately 87 at Step Number 0 and shows a decreasing trend.
* At Step Number 100: Approximately 61
* At Step Number 200: Approximately 44
* At Step Number 300: Approximately 31
* At Step Number 400: Approximately 25
* At Step Number 500: Approximately 20
* At Step Number 600: Approximately 15
* At Step Number 700: Approximately 16
* At Step Number 800: Approximately 21
All three lines exhibit a similar decreasing trend initially, but they diverge slightly between Step Numbers 500 and 800. The NetLogo line appears to reach the lowest heading difference around Step Number 600, while the Hybrid (LLM) line shows a slight increase in heading difference towards Step Number 800.
### Key Observations
* All three model variants demonstrate a reduction in heading difference as the step number increases.
* The NetLogo model consistently exhibits a lower heading difference compared to the other two models, particularly after Step Number 500.
* The Hybrid (LLM) model shows a slight increase in heading difference towards the end of the simulation (Step Numbers 700-800), while the other two models remain relatively stable.
* The differences between the models become more pronounced in the later stages of the simulation.
### Interpretation
The chart suggests that all three models are converging towards a similar heading over time, as indicated by the decreasing heading difference. However, the NetLogo model appears to converge faster and to a lower heading difference than the hybrid models. The slight increase in heading difference observed for the Hybrid (LLM) model towards the end of the simulation could indicate instability or a delayed convergence.
The data implies that the NetLogo model might be more efficient or stable in reaching a consensus heading compared to the hybrid models. The hybrid models, combining LLM and NetLogo approaches, may require more steps to achieve a similar level of convergence. The divergence in the later stages suggests that the models are exploring different solution spaces or are affected by different factors as they approach convergence. Further investigation would be needed to understand the reasons behind these differences and to optimize the hybrid models for faster and more stable convergence.