## Line Chart: Heading Difference vs. Step Number for Three Model Variants
### Overview
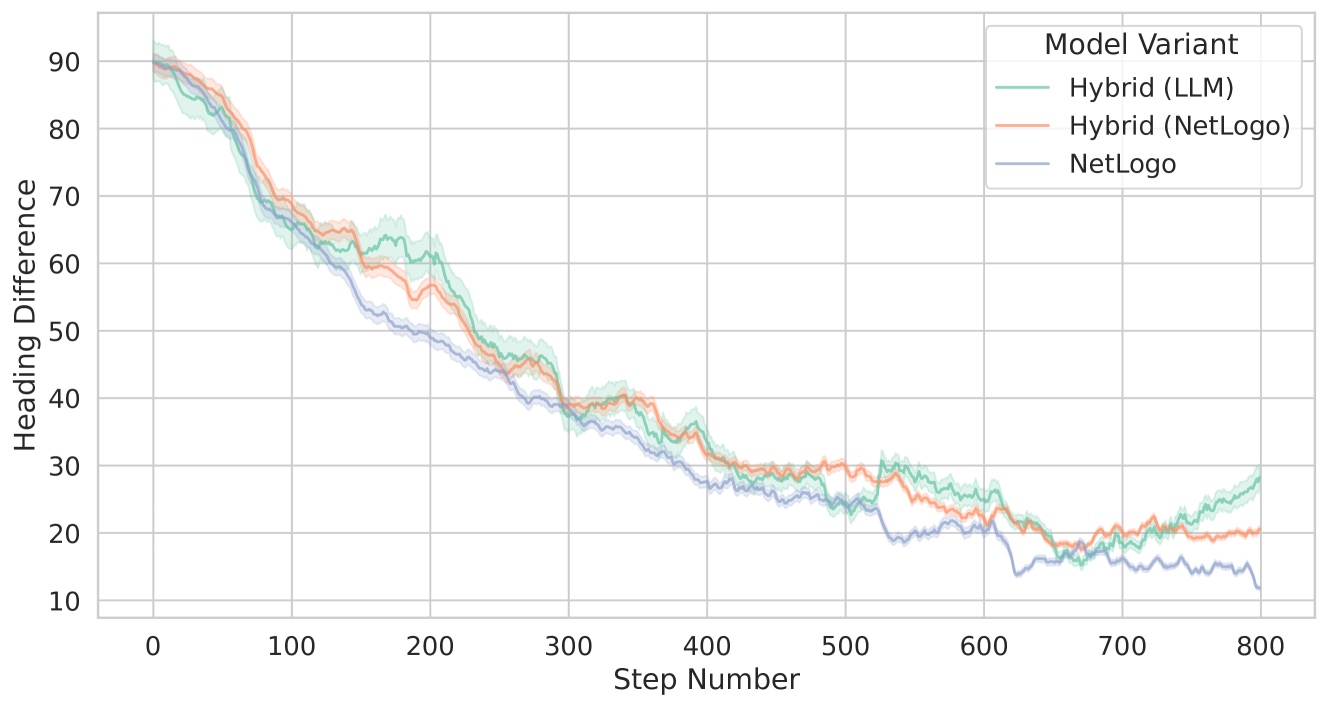
The image is a line chart comparing the performance of three model variants over 800 steps. The chart plots "Heading Difference" (y-axis) against "Step Number" (x-axis). All three models start with a high heading difference that decreases over time, but they exhibit different rates of decline and final values. Each line is accompanied by a shaded region, likely representing confidence intervals or standard deviation.
### Components/Axes
- **Title**: None explicitly shown, but the chart is clearly a performance comparison.
- **X-Axis**: Labeled "Step Number". Scale ranges from 0 to 800 with major tick marks every 100 steps.
- **Y-Axis**: Labeled "Heading Difference". Scale ranges from 10 to 90 with major tick marks every 10 units.
- **Legend**: Located in the top-right corner. It lists three "Model Variant" entries:
1. **Hybrid (LLM)**: Represented by a green line.
2. **Hybrid (NetLogo)**: Represented by an orange line.
3. **NetLogo**: Represented by a blue line.
- **Data Series**: Three lines with associated shaded bands (green, orange, blue) corresponding to the legend.
### Detailed Analysis
**Trend Verification & Data Points (Approximate):**
* **General Trend**: All three lines show a strong, consistent downward trend from step 0 to approximately step 400. After step 400, the decline slows, and the lines exhibit more fluctuation and noise.
* **NetLogo (Blue Line)**:
* **Trend**: Steepest initial decline. It separates from the other two lines early, dropping below them by step 100.
* **Key Points**: Starts at ~90 (step 0). Drops to ~65 (step 100), ~50 (step 200), ~40 (step 300), ~28 (step 400), ~25 (step 500), ~20 (step 600), ~15 (step 700), and ends at ~12 (step 800). It is consistently the lowest line after step 100.
* **Hybrid (LLM) (Green Line)**:
* **Trend**: Declines more gradually than the blue line initially. It remains the highest of the three lines for most of the chart's duration, especially between steps 100-300.
* **Key Points**: Starts at ~90 (step 0). Drops to ~70 (step 100), ~62 (step 200), ~42 (step 300), ~35 (step 400), ~30 (step 500), ~28 (step 600), ~20 (step 700), and ends at ~28 (step 800). It shows a slight upward tick in the final 100 steps.
* **Hybrid (NetLogo) (Orange Line)**:
* **Trend**: Follows a path between the other two lines for the first half of the chart. After step 400, it closely tracks the green line.
* **Key Points**: Starts at ~90 (step 0). Drops to ~75 (step 100), ~58 (step 200), ~40 (step 300), ~32 (step 400), ~30 (step 500), ~25 (step 600), ~20 (step 700), and ends at ~20 (step 800).
**Spatial Grounding & Confidence Bands**:
* The shaded bands are widest for the green line (Hybrid LLM) between steps 100-300, indicating higher variance in its performance during that phase.
* The bands for all three models narrow significantly after step 400, suggesting more consistent performance across runs in the later stages.
* The blue line's band is the narrowest throughout, indicating the most consistent performance for the NetLogo model.
### Key Observations
1. **Convergence Point**: All three models converge to a similar heading difference value of approximately 40 around step 300.
2. **Divergence After Convergence**: After the convergence point, the models diverge again. The NetLogo (blue) model continues to improve (lower heading difference) at a faster rate than the two hybrid models.
3. **Final Performance Hierarchy**: At step 800, the final performance order from best (lowest difference) to worst is: NetLogo (blue, ~12) > Hybrid (NetLogo) (orange, ~20) > Hybrid (LLM) (green, ~28).
4. **Late-Stage Behavior**: The Hybrid (LLM) model shows a slight degradation in performance (increase in heading difference) in the final 100 steps, while the other two models remain stable or continue to improve slightly.
### Interpretation
The chart demonstrates a clear performance comparison between a pure NetLogo model and two hybrid approaches (LLM-based and NetLogo-based) on a task measured by "Heading Difference." The data suggests:
* **Initial Learning Speed**: The pure NetLogo model learns or adapts the fastest initially, achieving a lower heading difference more quickly than the hybrid models.
* **Long-Term Performance**: Despite a slower start, the pure NetLogo model ultimately achieves the best (lowest) final heading difference. This indicates it may be more effective or stable for this specific task over a long horizon.
* **Hybrid Model Trade-offs**: The hybrid models, particularly the Hybrid (LLM) variant, show more variability (wider confidence bands) during the mid-stage of the process. Their final performance is worse than the pure NetLogo model, suggesting that the integration of an LLM or a hybrid architecture may introduce complexity or overhead that does not translate to better final outcomes for this metric.
* **Task Nature**: The consistent downward trend for all models implies the task involves a learning or optimization process where agents/agents progressively reduce their heading error. The fluctuations after step 400 could indicate the task becomes more stochastic or that the models reach a performance plateau where fine-tuning is noisy.
In summary, for minimizing "Heading Difference" over 800 steps, the pure NetLogo model appears to be the most effective, offering both the fastest initial improvement and the best final result. The hybrid approaches, while functional, do not outperform the simpler model on this specific metric.