## Line Graph: Model Variant Performance Over Steps
### Overview
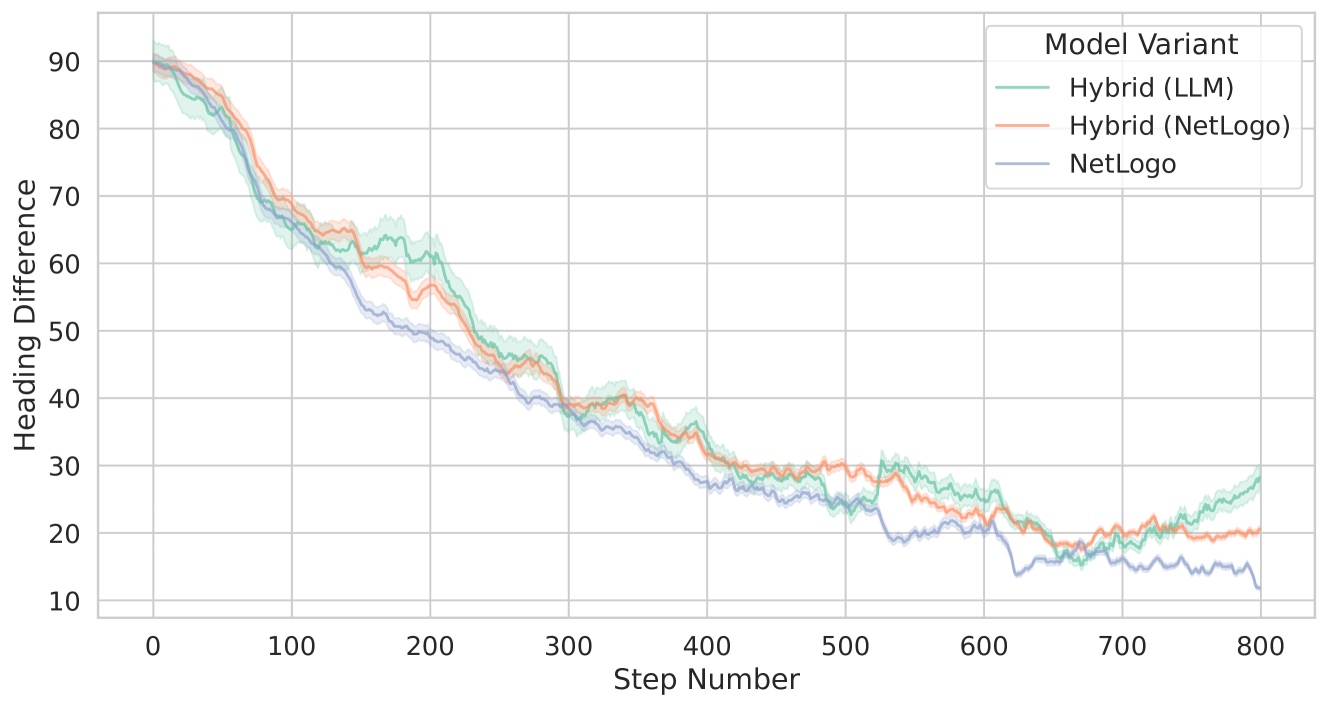
The image is a line graph comparing the performance of three model variants—Hybrid (LLM), Hybrid (NetLogo), and NetLogo—over 800 steps. The y-axis measures "Heading Difference" (ranging from 10 to 90), while the x-axis represents "Step Number" (0 to 800). The graph shows three colored lines (green, orange, blue) with shaded confidence intervals, indicating variability in performance.
### Components/Axes
- **Title**: "Model Variant" (top-right corner).
- **Legend**:
- Green: Hybrid (LLM)
- Orange: Hybrid (NetLogo)
- Blue: NetLogo
- **X-axis**: "Step Number" (0–800, increments of 100).
- **Y-axis**: "Heading Difference" (10–90, increments of 10).
- **Gridlines**: Horizontal and vertical gridlines for reference.
### Detailed Analysis
1. **Hybrid (LLM) (Green Line)**:
- Starts at ~90 at step 0, decreasing steadily to ~25 at step 800.
- Shows moderate fluctuations (e.g., ~65 at step 100, ~50 at step 200, ~40 at step 300).
- Confidence interval widens slightly around steps 200–300.
2. **Hybrid (NetLogo) (Orange Line)**:
- Begins at ~90 at step 0, declining to ~20 at step 800.
- Slightly lower than Hybrid (LLM) at most steps (e.g., ~60 at step 100, ~45 at step 200).
- Confidence interval narrows after step 400.
3. **NetLogo (Blue Line)**:
- Starts at ~85 at step 0, decreasing to ~15 at step 800.
- Smoother trend with minimal fluctuations (e.g., ~50 at step 200, ~30 at step 400).
- Confidence interval remains narrow throughout.
### Key Observations
- All models show a **downward trend** in heading difference over steps, indicating improved performance.
- **Hybrid (LLM)** and **Hybrid (NetLogo)** start higher than NetLogo but converge with it by step 800.
- **Hybrid (LLM)** has the highest initial performance but experiences more variability.
- **NetLogo** maintains a steadier decline but ends with the lowest heading difference.
### Interpretation
The data suggests that **Hybrid models** (both LLM and NetLogo) outperform the standalone NetLogo model in early steps, likely due to combined algorithmic strengths. However, by step 800, all models converge, with NetLogo achieving the lowest heading difference. The fluctuations in Hybrid (LLM) may reflect computational complexity or parameter sensitivity, while NetLogo’s stability implies robustness. The shaded confidence intervals highlight uncertainty, with Hybrid (LLM) showing the greatest variability. This could indicate trade-offs between model complexity and consistency.