\n
## Diagram: Medical Diagnosis Flow
### Overview
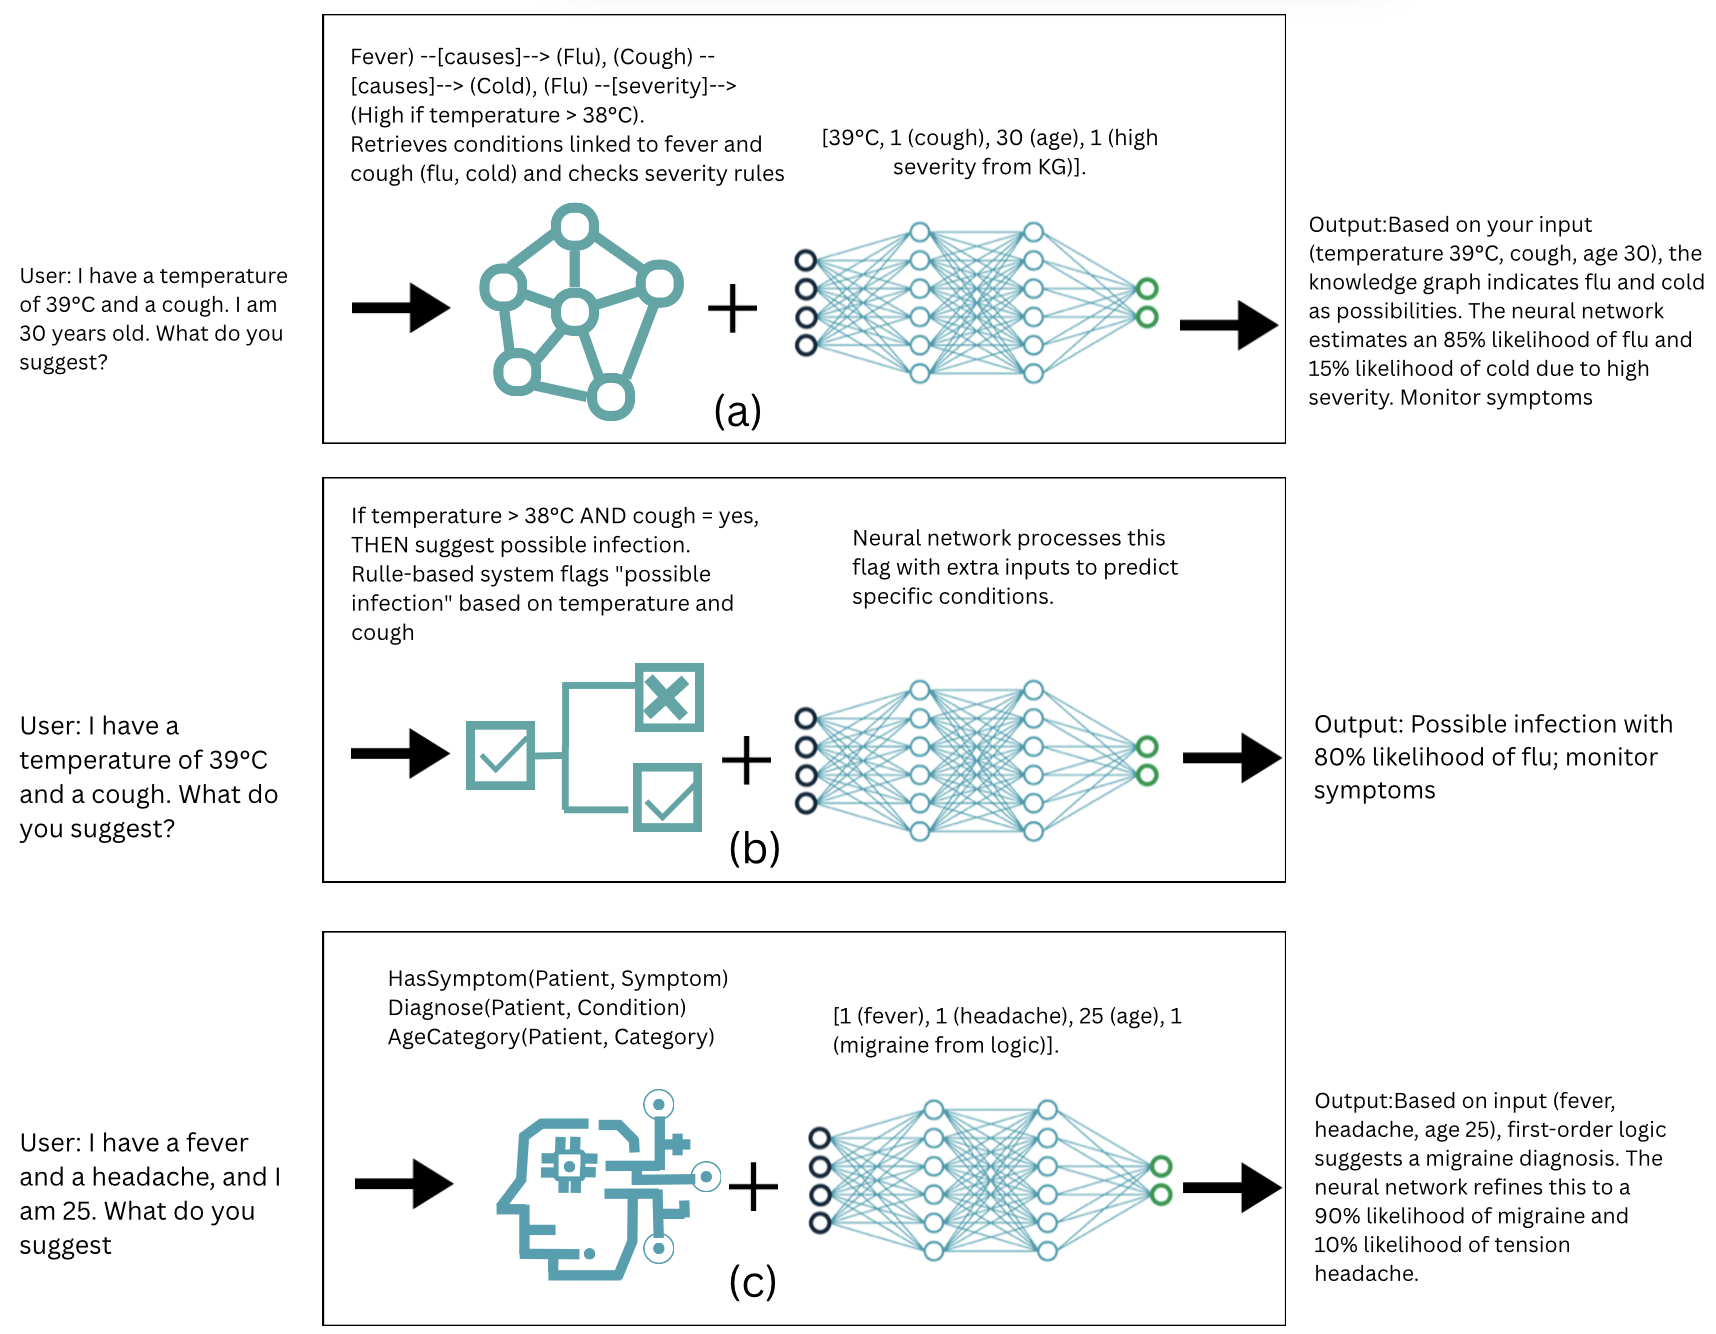
This diagram illustrates a three-case comparison of a medical diagnosis system's workflow, showing how user input (symptoms and age) is processed through a knowledge graph and a neural network to generate a diagnosis and likelihood estimate. Each case (a, b, c) represents a different user query and the system's response.
### Components/Axes
The diagram consists of three horizontally arranged sections (a, b, c), each representing a distinct diagnostic scenario. Each section contains the following components:
* **User Input:** A text box representing the user's query.
* **Knowledge Graph/Rule-Based System:** A visual representation of a knowledge graph (a network of nodes and edges) or a rule-based system (checkmarks and crosses).
* **Input Data:** A bracketed list of numerical data representing the input features extracted from the user query.
* **Neural Network:** A visual representation of a neural network (a network of interconnected nodes).
* **Output:** A text box displaying the system's diagnosis and likelihood estimate.
* **Textual Descriptions:** Explanatory text describing the process within each section.
### Detailed Analysis or Content Details
**Case (a): Fever, Cough, Age 30**
* **User Input:** "User: I have a temperature of 39°C and a cough. I am 30 years old. What do you suggest?"
* **Knowledge Graph:** A network of interconnected nodes representing relationships between fever, cough, flu, cold, and severity. The text above the graph states: "Fever --> [causes] --> (Flu, Cough) --> [causes] --> (Cold, Flu) --> [severity] --> [High if temperature > 38°C]. Retrieves conditions linked to fever and cough (flu, cold) and checks severity rules."
* **Input Data:** "[39°C, 1 cough, 30 (age), 1 (high severity from KG)]."
* **Neural Network:** A network of interconnected nodes.
* **Output:** "Output: Based on your input (temperature 39°C, cough, age 30), the knowledge graph indicates flu and cold as possibilities. The neural network estimates an 85% likelihood of flu and 15% likelihood of cold due to high severity. Monitor symptoms."
**Case (b): Fever, Cough, Age 30 (Repeat)**
* **User Input:** "User: I have a temperature of 39°C and a cough. What do you suggest?"
* **Rule-Based System:** A checkmark and cross symbol representing a rule-based system. The text states: "If temperature > 38°C AND cough = yes, THEN suggest possible infection. Rule-based system flags “possible infection” based on temperature and cough."
* **Input Data:** "[39°C, 1 cough, 30 (age), 1 (high severity from KG)]."
* **Neural Network:** A network of interconnected nodes.
* **Output:** "Output: Possible infection with 80% likelihood of flu; monitor symptoms."
**Case (c): Fever, Headache, Age 25**
* **User Input:** "User: I have a fever and a headache, and I am 25. What do you suggest?"
* **Knowledge Graph:** A network of interconnected nodes representing relationships between symptoms, diagnoses, and age categories. The text states: "HasSymptom(Patient, Symptom) Diagnose(Patient, Condition) AgeCategory(Patient, Category)"
* **Input Data:** "[1 fever, 1 headache, 25 (age), 1 (migraine from logic)]."
* **Neural Network:** A network of interconnected nodes.
* **Output:** "Output: Based on input (fever, headache, age 25), first-order logic suggests a migraine diagnosis. The neural network refines this to a 90% likelihood of migraine and 10% likelihood of tension headache."
### Key Observations
* The system utilizes both a knowledge graph/rule-based system and a neural network for diagnosis.
* The knowledge graph/rule-based system provides initial possibilities, while the neural network refines the likelihood estimates.
* The input data consistently includes temperature, symptom count, age, and a severity/logic indicator.
* The output consistently provides a diagnosis and a likelihood estimate.
* The likelihood estimates vary depending on the input symptoms and age.
* Case (a) and (b) have identical user input, but slightly different outputs, suggesting the system isn't deterministic.
### Interpretation
The diagram demonstrates a hybrid approach to medical diagnosis, combining the structured reasoning of a knowledge graph/rule-based system with the pattern recognition capabilities of a neural network. The knowledge graph/rule-based system acts as a first pass, identifying potential conditions based on predefined rules and relationships. The neural network then refines these possibilities, taking into account the nuances of the input data to provide a more accurate likelihood estimate. The variation in outputs for identical inputs (cases a and b) suggests the neural network introduces a degree of stochasticity, potentially reflecting the inherent uncertainty in medical diagnosis. The system appears to prioritize flu and cold for fever/cough combinations and migraine for fever/headache combinations, indicating a bias towards common conditions. The inclusion of age as an input feature suggests the system considers age-related risk factors in its diagnosis.