## Multi-Panel Line Chart: Impact of Masked Attention Heads on Model Performance
### Overview
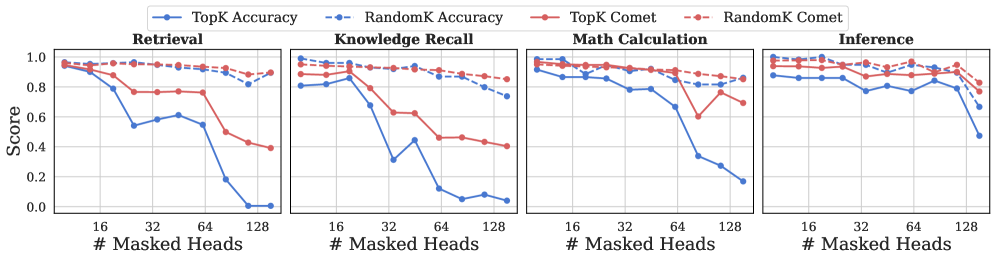
The image displays a set of four line charts arranged horizontally, comparing the performance of two methods ("TopK" and "RandomK") across four different tasks as the number of masked attention heads increases. Each chart plots two metrics: "Accuracy" (solid lines, left y-axis) and "Comet" (dashed lines, right y-axis). The overall trend shows that performance, particularly Accuracy, degrades as more heads are masked, with the "TopK" method generally being more sensitive than "RandomK".
### Components/Axes
* **Legend:** Positioned at the top center of the entire figure. It defines four data series:
* `TopK Accuracy`: Solid blue line with circular markers.
* `RandomK Accuracy`: Dashed blue line with circular markers.
* `TopK Comet`: Solid red line with circular markers.
* `RandomK Comet`: Dashed red line with circular markers.
* **X-Axis (Common to all subplots):** Labeled "# Masked Heads". It has major tick marks at 16, 32, 64, and 128. The scale appears to be logarithmic (base 2).
* **Y-Axis (Left, for Accuracy):** Labeled "Score" on the leftmost chart. The scale ranges from 0.0 to 1.0 with increments of 0.2.
* **Y-Axis (Right, for Comet):** Not explicitly labeled with text, but implied by the dashed lines and the legend. The scale is also 0.0 to 1.0.
* **Subplot Titles:** Each of the four panels has a title at its top center:
1. **Retrieval** (Leftmost panel)
2. **Knowledge Recall** (Second from left)
3. **Math Calculation** (Third from left)
4. **Inference** (Rightmost panel)
### Detailed Analysis
**1. Retrieval Task (Left Panel)**
* **TopK Accuracy (Solid Blue):** Starts high (~0.95 at 0-16 heads). Drops sharply after 32 heads, falling to ~0.55 at 64 heads, and plummets to near 0.0 by 128 heads.
* **RandomK Accuracy (Dashed Blue):** Starts high (~0.95). Shows a very gradual, slight decline, remaining above ~0.85 even at 128 heads.
* **TopK Comet (Solid Red):** Starts high (~0.95). Declines steadily after 16 heads, reaching ~0.4 by 128 heads.
* **RandomK Comet (Dashed Red):** Starts high (~0.95). Remains very stable and high, showing only a minimal decrease to ~0.9 by 128 heads.
**2. Knowledge Recall Task (Second Panel)**
* **TopK Accuracy (Solid Blue):** Starts around ~0.8. Drops dramatically after 16 heads, hitting a low of ~0.3 at 32 heads, recovers slightly to ~0.45 at 64 heads, then falls to near 0.0 by 128 heads.
* **RandomK Accuracy (Dashed Blue):** Starts around ~0.8. Declines gradually and linearly to ~0.75 by 128 heads.
* **TopK Comet (Solid Red):** Starts around ~0.95. Declines steadily to ~0.4 by 128 heads.
* **RandomK Comet (Dashed Red):** Starts around ~0.95. Remains very stable, ending near ~0.85.
**3. Math Calculation Task (Third Panel)**
* **TopK Accuracy (Solid Blue):** Starts high (~0.95). Declines gradually until 64 heads (~0.7), then drops sharply to ~0.35 at 128 heads.
* **RandomK Accuracy (Dashed Blue):** Starts high (~0.95). Shows a very slow, linear decline to ~0.8 by 128 heads.
* **TopK Comet (Solid Red):** Starts high (~0.95). Remains stable until 64 heads, then drops sharply to ~0.6 at 128 heads.
* **RandomK Comet (Dashed Red):** Starts high (~0.95). Remains very stable, ending near ~0.85.
**4. Inference Task (Right Panel)**
* **TopK Accuracy (Solid Blue):** Starts around ~0.85. Shows a fluctuating but generally downward trend, with a notable dip at 32 heads (~0.75), a recovery at 64 heads (~0.85), and a final drop to ~0.5 by 128 heads.
* **RandomK Accuracy (Dashed Blue):** Starts around ~0.85. Declines very gradually to ~0.7 by 128 heads.
* **TopK Comet (Solid Red):** Starts around ~0.95. Fluctuates but maintains a high level, ending near ~0.85.
* **RandomK Comet (Dashed Red):** Starts around ~0.95. Remains very stable and high, ending near ~0.9.
### Key Observations
1. **Method Sensitivity:** The "TopK" method (solid lines) is consistently and significantly more sensitive to the number of masked heads than the "RandomK" method (dashed lines). This is true for both Accuracy and Comet metrics across all tasks.
2. **Metric Divergence:** For the "TopK" method, the Accuracy metric (blue solid) degrades much more severely and rapidly than the Comet metric (red solid). For "RandomK", both metrics remain relatively stable.
3. **Task Variability:** The "Knowledge Recall" task shows the most severe and early drop in TopK Accuracy. The "Inference" task shows the most fluctuation in its TopK Accuracy trend.
4. **Threshold Effect:** For TopK Accuracy, there appears to be a critical threshold between 32 and 64 masked heads where performance begins to collapse in most tasks (Retrieval, Math Calculation).
### Interpretation
This data demonstrates a fundamental difference between two strategies for selecting which attention heads to mask. The "RandomK" approach is highly robust; masking heads randomly has a minimal negative impact on both task accuracy and the "Comet" metric (likely a measure of output quality or coherence). This suggests that many attention heads are redundant or can be compensated for by others.
In stark contrast, the "TopK" approach—presumably masking the heads deemed most important by some criterion—is highly destructive. The catastrophic drop in Accuracy indicates that these "TopK" heads are indeed critical for the model's task performance. The fact that the Comet score degrades more slowly suggests that while the model's ability to produce a correct answer (Accuracy) is crippled, its general output quality or fluency (Comet) is somewhat more resilient, though still negatively affected.
The findings imply that the model's knowledge and reasoning capabilities are concentrated in a subset of attention heads. Identifying and preserving these heads is crucial for maintaining performance under parameter reduction or efficiency constraints. Conversely, random pruning is a surprisingly effective strategy for reducing model size with minimal performance loss. The variability across tasks (e.g., Knowledge Recall being most sensitive) also indicates that different capabilities rely on different internal structures within the model.