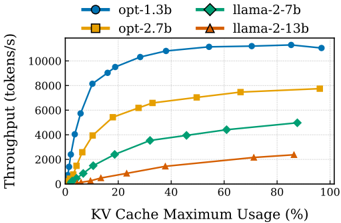
## Line Chart: Throughput (tokens/s) vs KV Cache Maximum Usage (%)
### Overview
The chart compares the throughput (tokens processed per second) of four AI models (opt-1.3b, opt-2.7b, llama-2-7b, llama-2-13b) as KV cache maximum usage increases from 0% to 100%. Throughput is plotted on the y-axis (logarithmic scale), and KV cache usage is on the x-axis (linear scale). All models show diminishing returns in throughput gains as cache usage increases, with plateaus observed at higher usage levels.
### Components/Axes
- **X-axis**: KV Cache Maximum Usage (%)
- Range: 0% to 100%
- Increment: 20%
- **Y-axis**: Throughput (tokens/s)
- Range: 0 to 10,000 tokens/s
- Scale: Logarithmic (base 10)
- **Legend**: Top-left corner
- opt-1.3b: Blue circles (●)
- opt-2.7b: Orange squares (■)
- llama-2-7b: Green diamonds (♦)
- llama-2-13b: Orange triangles (▲)
### Detailed Analysis
1. **opt-1.3b (Blue Circles)**
- **Trend**: Sharp initial increase, plateauing at ~10,000 tokens/s after 40% cache usage.
- **Key Points**:
- 0%: ~1,000 tokens/s
- 20%: ~8,000 tokens/s
- 40%: ~10,000 tokens/s
- 60%–100%: Stable at ~10,000 tokens/s
2. **opt-2.7b (Orange Squares)**
- **Trend**: Steady rise, plateauing at ~8,000 tokens/s after 80% cache usage.
- **Key Points**:
- 0%: ~2,000 tokens/s
- 20%: ~6,000 tokens/s
- 40%: ~7,000 tokens/s
- 60%: ~7,500 tokens/s
- 80%–100%: Stable at ~8,000 tokens/s
3. **llama-2-7b (Green Diamonds)**
- **Trend**: Gradual increase, plateauing at ~5,000 tokens/s after 80% cache usage.
- **Key Points**:
- 0%: ~500 tokens/s
- 20%: ~2,500 tokens/s
- 40%: ~4,000 tokens/s
- 60%: ~4,500 tokens/s
- 80%–100%: Stable at ~5,000 tokens/s
4. **llama-2-13b (Orange Triangles)**
- **Trend**: Slowest growth, plateauing at ~2,500 tokens/s after 80% cache usage.
- **Key Points**:
- 0%: ~100 tokens/s
- 20%: ~1,000 tokens/s
- 40%: ~1,500 tokens/s
- 60%: ~2,000 tokens/s
- 80%–100%: Stable at ~2,500 tokens/s
### Key Observations
- **Diminishing Returns**: All models exhibit plateauing throughput beyond a certain cache usage threshold (40–80%), indicating limited benefits from further cache allocation.
- **Performance Hierarchy**:
- opt-1.3b outperforms all models at higher cache usage (60%+).
- opt-2.7b maintains second-highest throughput but plateaus earlier (~80%).
- llama-2-7b and llama-2-13b show lower throughput, with the latter being the least efficient.
- **Model Size vs. Efficiency**: Larger models (opt-2.7b, llama-2-13b) achieve higher absolute throughput but require more cache to do so, suggesting trade-offs between model size and resource efficiency.
### Interpretation
The data highlights the relationship between cache efficiency and model performance. The opt-1.3b model demonstrates the highest throughput efficiency, likely due to optimized architecture or smaller size enabling faster processing. Larger models (opt-2.7b, llama-2-13b) require significantly more cache to achieve comparable throughput, indicating potential inefficiencies in memory management or computational overhead. The plateauing trends suggest that optimizing cache usage up to the inflection point (e.g., 40–60%) could maximize performance without unnecessary resource allocation. This has implications for deploying AI systems in resource-constrained environments, where balancing model size and cache efficiency is critical.