## Line Graph: Mel-reconstruction loss vs Bitrate (kbps)
### Overview
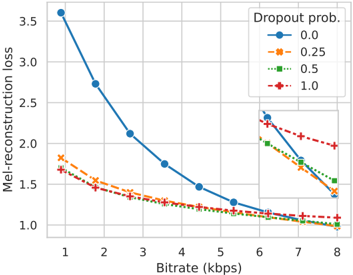
The graph illustrates the relationship between bitrate (kbps) and mel-reconstruction loss for different dropout probabilities (0.0, 0.25, 0.5, 1.0). Four distinct lines represent the performance of models with varying dropout rates, showing how reconstruction loss decreases as bitrate increases. An inset provides a zoomed-in view of the lower bitrate range (1-3 kbps).
### Components/Axes
- **X-axis**: Bitrate (kbps), ranging from 1 to 8 in integer increments.
- **Y-axis**: Mel-reconstruction loss, scaled from 1.0 to 3.5.
- **Legend**: Located in the top-right corner, mapping colors/markers to dropout probabilities:
- Blue circles: 0.0
- Orange crosses: 0.25
- Green squares: 0.5
- Red pluses: 1.0
- **Inset**: A secondary graph in the bottom-right corner, focusing on bitrates 1-3 kbps.
### Detailed Analysis
1. **Dropout 0.0 (Blue Circles)**:
- Starts at ~3.5 loss at 1 kbps.
- Decreases sharply to ~1.2 loss at 8 kbps.
- Steepest decline between 1-4 kbps.
2. **Dropout 0.25 (Orange Crosses)**:
- Begins at ~1.8 loss at 1 kbps.
- Gradual decline to ~1.0 loss at 8 kbps.
- Slope less steep than dropout 0.0.
3. **Dropout 0.5 (Green Squares)**:
- Initial loss ~1.6 at 1 kbps.
- Slow decrease to ~1.0 loss at 8 kbps.
- Flattest slope among all dropout rates.
4. **Dropout 1.0 (Red Pluses)**:
- Starts at ~1.5 loss at 1 kbps.
- Minimal decline to ~1.0 loss at 8 kbps.
- Nearly horizontal line after 3 kbps.
**Inset Observations**:
- At 1-3 kbps, all lines converge closer together.
- Dropout 0.0 remains the highest loss in this range.
- Dropout 1.0 shows the smallest loss even at 1 kbps.
### Key Observations
- **Inverse Relationship**: Higher bitrates consistently reduce mel-reconstruction loss across all dropout probabilities.
- **Dropout Impact**: Higher dropout probabilities (0.5, 1.0) achieve lower loss at equivalent bitrates compared to lower dropout rates (0.0, 0.25).
- **Diminishing Returns**: The rate of loss reduction slows significantly after 4 kbps for all dropout settings.
- **Inset Clarity**: The zoomed view confirms the trend holds at lower bitrates but highlights tighter clustering of lines.
### Interpretation
The data demonstrates that:
1. **Bitrate Optimization**: Increasing bitrate improves reconstruction quality, with the most significant gains at lower bitrates (1-4 kbps).
2. **Regularization Effect**: Higher dropout probabilities (0.5, 1.0) act as effective regularizers, reducing overfitting and improving generalization, as evidenced by lower loss at equivalent bitrates.
3. **Trade-off Analysis**: While dropout 0.0 requires higher bitrates to achieve comparable loss to higher dropout settings, it may be preferable in scenarios where computational resources (bitrate) are abundant.
4. **Practical Implications**: The inset suggests that even modest bitrate increases (1-3 kbps) yield meaningful improvements, making this range critical for real-time applications with bandwidth constraints.
**Notable Anomalies**: None observed. All trends align with expected model behavior under varying regularization and input resolution.