## Diagram: Adaptive Retrieval and Classification Training
### Overview
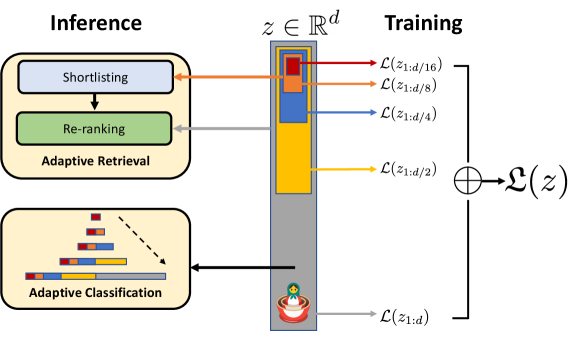
The image is a diagram illustrating a process involving inference and training, likely within a machine learning context. It shows the flow of data and operations between "Inference" and "Training" stages, highlighting adaptive retrieval and classification.
### Components/Axes
* **Title:** The diagram is implicitly titled "Adaptive Retrieval and Classification Training" based on the elements depicted.
* **Sections:** The diagram is divided into two main sections: "Inference" (left) and "Training" (right).
* **Inference Block:** Contains "Shortlisting" and "Re-ranking" steps within an "Adaptive Retrieval" box. Also contains an "Adaptive Classification" box.
* **Training Block:** Features a vertical stack of colored rectangles representing different levels or components of a variable 'z', where z ∈ R^d. These components are associated with loss functions L(z1:d/16), L(z1:d/8), L(z1:d/4), L(z1:d/2), and L(z1:d).
* **Connections:** Arrows indicate the flow of information between the blocks.
* **Loss Function Summation:** A summation symbol (⊕) combines the loss functions to produce a final loss L(z).
### Detailed Analysis
* **Inference - Adaptive Retrieval:**
* "Shortlisting" (top, light blue box) feeds into "Re-ranking" (green box).
* Both are contained within a rounded-corner box labeled "Adaptive Retrieval" (tan background).
* **Inference - Adaptive Classification:**
* Located below "Adaptive Retrieval" (tan background).
* Contains a series of stacked rectangles, similar to the "Training" block, but arranged in a pyramid-like structure. The rectangles are colored red, orange, blue, and yellow.
* A dashed line connects the top of the pyramid to the bottom, suggesting a progressive classification process.
* **Training - Variable z:**
* A vertical stack of colored rectangles, enclosed in a grey border. From top to bottom, the rectangles are red, orange, blue, and yellow. A small red/white icon is at the bottom.
* Each rectangle corresponds to a loss function:
* Red: L(z1:d/16)
* Orange: L(z1:d/8)
* Blue: L(z1:d/4)
* Yellow: L(z1:d/2)
* Grey: L(z1:d)
* **Connections:**
* An orange arrow connects "Shortlisting" to the red rectangle in the "Training" block.
* A grey arrow connects "Re-ranking" to the orange rectangle in the "Training" block.
* A black arrow connects "Adaptive Classification" to the grey rectangle in the "Training" block.
* A blue arrow connects the blue rectangle to the summation symbol.
* A yellow arrow connects the yellow rectangle to the summation symbol.
* The summation symbol (⊕) combines the loss functions and outputs L(z).
### Key Observations
* The diagram illustrates a multi-stage process where inference results are used to train a model.
* The "Training" block represents a hierarchical structure of the variable 'z', with different levels contributing to the overall loss function.
* The "Adaptive Classification" block mirrors the structure in the "Training" block, suggesting a relationship between classification granularity and the variable's components.
### Interpretation
The diagram depicts a system where inference (adaptive retrieval and classification) informs the training of a model. The model's training process involves a variable 'z' that is decomposed into different levels (z1:d/16, z1:d/8, z1:d/4, z1:d/2, z1:d), each associated with a loss function. The adaptive retrieval process, through shortlisting and re-ranking, likely selects relevant components of 'z' for training. The adaptive classification process provides further information to refine the training. The summation of individual loss functions suggests a joint optimization strategy. The diagram highlights the adaptive nature of both the retrieval and classification processes, indicating that the system dynamically adjusts its behavior based on the input data.